Mortgage Rates Hit 6.66%: What Investors Must Do Now
Sep 02, 2026
Written by Discount Property Investor Team
The average 30-year fixed mortgage rate edged up to 6.66% for the week ending August 27, 2026, as documented in Freddie Mac's Primary Mortgage Market Survey data. That marks an uptick of one basis point from the prior week's 6.65%, putting borrowing benchmarks right back to where they hovered a month earlier and keeping financing costs near their highest thresholds in 13 months.
For retail consumers relying on standard financing, this stubborn elevation feels like another door slamming shut on homeownership. But for real estate investors evaluating deal flow, cap rates, and capital structures, this specific late-summer inflection point tells a very different story.
We are witnessing a divergence across the macro landscape: active inventory is expanding toward multi-month highs, motivated sellers are trimming prices, and traditional buyer demand is stalling out. This disconnect creates a rare, selective operational window where prepared operators can negotiate terms, secure concessions, and extract yield from an increasingly hesitant market.
What Is Actually Happening Right Now
Three defining macro and micro developments characterize the late-summer housing cycle:
-
Mortgage Rates Stabilize Near Multi-Month Highs: After volatile swings through late summer that briefly touched a peak of 6.69%, the 30-year benchmark has settled into a tight band between 6.65% and 6.66%. Concurrently, the benchmark 10-year Treasury yield hovered around 4.66% in late August, held elevated by persistent macroeconomic uncertainties and geopolitical flashpoints.
-
New Listings Surge While Contract Activity Weakens: According to Redfin's market research tracking new listings and pending contracts, new listings expanded 6.0% year-over-year to 376,235 for the four weeks ending August 23, marking their highest level since April. Over that identical window, pending home sales fell 3.1% year-over-year to 307,830—the softest reading recorded since February.
-
Total Inventory and Months of Supply Expand: Active listings reached 1.5 million properties nationwide, up 1.6% year-over-year and the highest level since May. This lifted the months-of-supply metric to 3.8. While this is technically below the traditional 4-to-5-month balance threshold, it represents a substantial loosening from the hyper-competitive conditions of 2024 and early 2025.
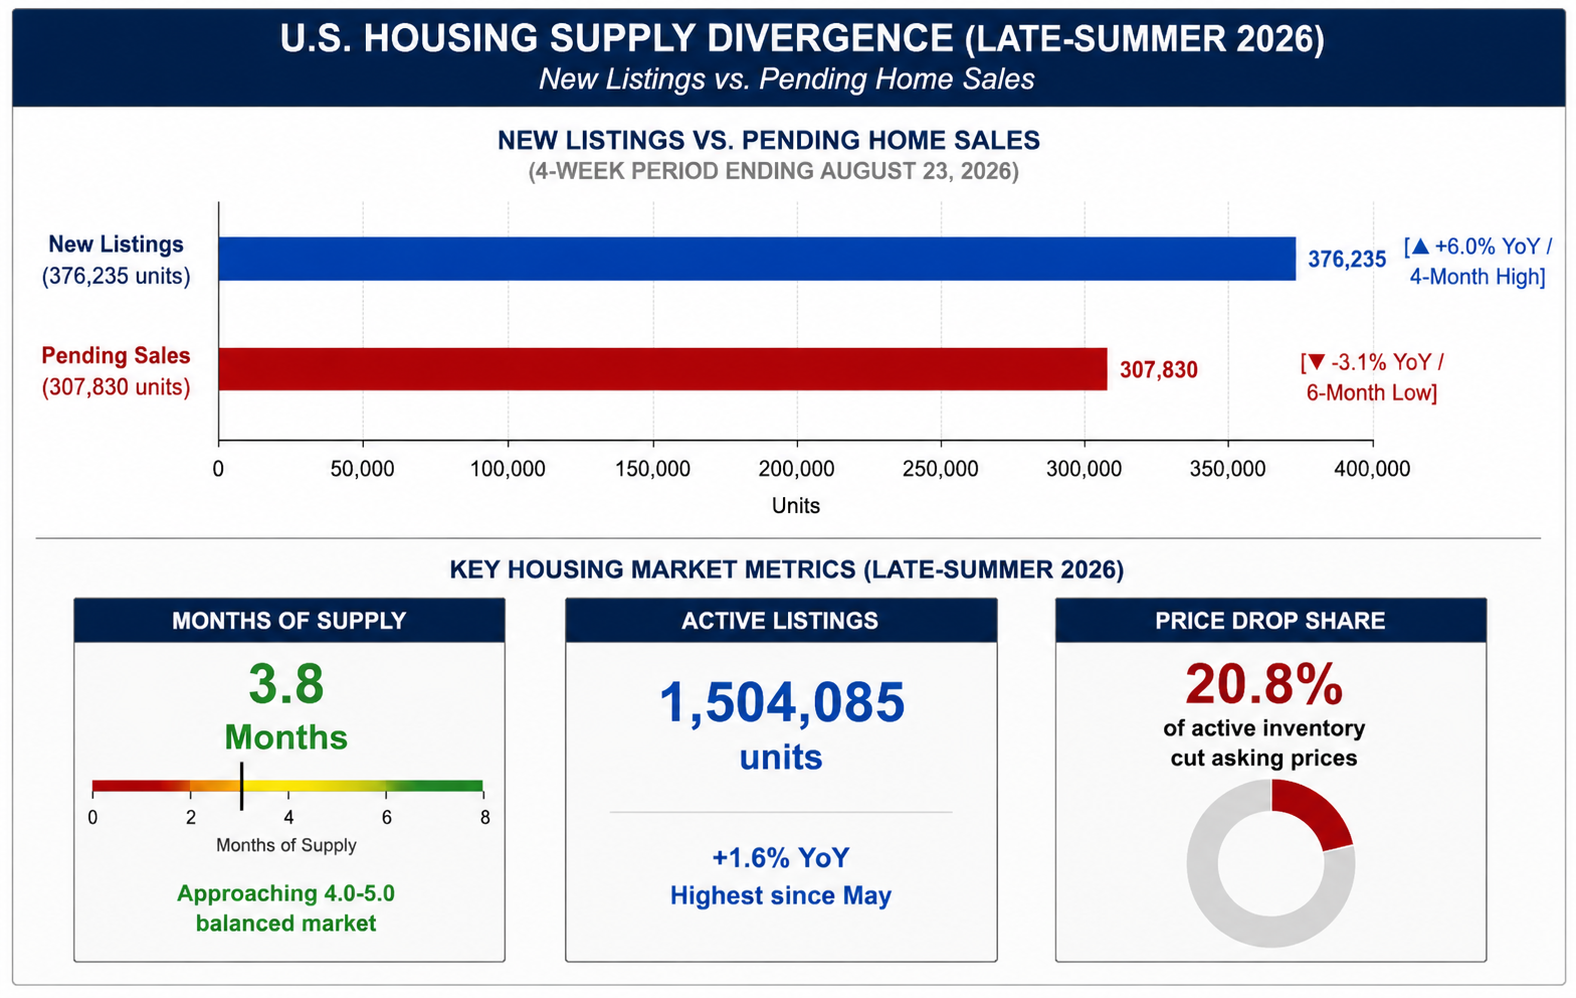
Insight: Widening gap between listing volume and buyer absorption provides direct leverage for investor negotiations and price discounts.
Market Fundamentals: Macro Data vs. Investor Action
Understanding the disconnect between headline figures and boots-on-the-ground investing allows capital allocators to pivot before the general public catches up.
| Market Metric | Current Reading | What It Means for Investors | Tactical Playbook |
|---|---|---|---|
|
30-Year Fixed Mortgage Rate |
6.66% (week ending Aug. 27) |
Retail end-buyers face debt-service fatigue, shrinking competition for institutional and private capital. |
Leverage non-bank capital, all-cash offers, or private lines of credit to extract deep acquisition discounts. |
|
Months of Inventory Supply |
3.8 Months (up from 3.7) |
Supply is creeping toward balanced market conditions; days-on-market are lengthening. |
Target tired listings approaching 45+ days; request seller-paid closing costs and interest rate buydowns. |
|
Pending Sales Volume |
-3.1% YoY to 307,830 |
Contract volume is dropping; sellers entering the fall cycle without offers face increasing urgency. |
Submit competitive offers with short contingency periods to lock in deals before seasonal freezes take hold. |
|
Price Reduction Share |
20.8% of Active Listings |
More than one in five sellers have officially slashed their initial listing price. |
Mine listings with recent price cuts for motivated sellers willing to accept non-traditional terms. |
|
Foreclosure Filings |
+10% YoY (July 2026) |
Distressed debt and default notices are re-emerging in select Sun Belt and high-growth markets. |
Build outreach systems for pre-foreclosures, probate, and lis pendens notices across Texas, Florida, and California. |
|
New Home Inventory Overhang |
9.6 Months of Supply |
Homebuilders hold substantial speculative stock that costs them substantial monthly interest to carry. |
Bypass individual resale owners and negotiate builder-financed rate buydowns, design upgrades, or bulk purchases. |
This is not an all-out market crash; it is an overdue return to structural pricing equilibrium. National home sale prices still logged a modest 1.9% year-over-year increase, reaching a median of $400,649. However, the wild double-digit appreciation that characterized prior years has evaporated, rewarding investors who underwrite strictly to predictable cash flow rather than speculative equity gains.
Who Is Feeling the Squeeze Most?
The current interest rate environment affects each real estate market segment differently:
| Investor / Buyer Type | Market Impact | Current Reality |
|---|---|---|
|
First-Time Homebuyers |
Debt Squeeze: Median monthly payment hits $2,600 (+0.6% YoY). |
High debt-to-income ratios keep entry-level buyers on the sidelines. |
|
Move-Up Homeowners |
Rate Lock-in vs. Stale Listings: Homes sit at 44 median days on market. |
Sellers face the reality that buyers won't pay speculative peaks. |
|
Fix-and-Flip Operators |
Holding-Cost Drag: Extended marketing cycles in TX, FL, and SE. |
Margin compression forces tighter rehab scopes and faster exits. |
|
Buy-and-Hold Landlords |
Stable Fundamentals: National occupancy remains solid at 95.5%. |
Strong rental demand compensates for elevated acquisition yields. |
1. First-Time Homebuyers Face Severe Payment Constraints
First-time buyers are experiencing the sharpest pinch. At an average rate of 6.65%, the median monthly mortgage payment sits at approximately $2,600, up 0.6% year-over-year. Because that payment consumes a historically high percentage of average household income, an entire generation of prospective buyers is stranded in the renter pool, reinforcing the multi-family and single-family rental asset classes.
2. Move-Up Sellers Stumble Over Pricing Expectations
Many retail sellers who listed their homes this summer expected multiple offers within 48 hours. Instead, median days on market have plateaued at 44 days. While this is stable compared to last year's metrics, over 20% of listings have been forced to implement price cuts to generate showing activity. Sellers who have already purchased their next residence or need to relocate for employment are transforming into motivated counter-parties.
3. Flipped Inventory and Development Cycle Variations
As highlighted in recent findings from
4. Buy-and-Hold Investors Rely on Strong Rental Fundamentals
Long-term landlords continue to find stability in operational fundamentals. National residential rental occupancy remains robust at 95.5%. While certain Sun Belt submarkets continue to absorb substantial deliveries of multi-family complexes built over recent years, core single-family rentals remain fully occupied, providing consistent cash flow against broader asset volatility.
What Investors Must Watch Before the September Fed Meeting
All eyes are turned toward the upcoming Federal Open Market Committee (FOMC) meeting scheduled for mid-September. Because this session includes an updated Summary of Economic Projections (the "dot plot"), fixed-income markets and mortgage lenders will trade with heightened sensitivity. Investors should track three key indicators closely:
Benchmark 10-Year Treasury Yields
Mortgage interest rates maintain a strong statistical correlation with the 10-year Treasury yield. The spread between the two currently fluctuates between 200 and 240 basis points, compared to the long-term historical norm of 170 basis points.
If Treasury yields pull back from the 4.66%–4.75% range on cooler inflation prints or shifting geopolitical winds, mortgage rates may decline toward the low 6% range. If yields remain elevated or bounce higher, rates could challenge the 6.75%–7.00% ceiling.
Metro-Level Foreclosure Filings and Default Velocity
A detailed breakdown from
Texas led the country with 3,306 foreclosure starts, followed closely by Florida and California. Tracking local notices of default and lis pendens filings gives cash-ready investors an inside track on motivated assets 60 to 120 days before they hit the open market.
New Construction Surplus vs. Resale Inventory
An analysis from
Builders are under intense pressure to clear finished specs before year-end, making them far more willing to negotiate forward rate commitments, design credits, and fee waivers than typical retail sellers.
The Investor Playbook: Five Actionable Steps for Today's Market
Navigating a 6.66% interest rate environment requires a clear shift from passive, appreciation-focused acquisitions to disciplined, active negotiation strategies.
1. Target Stale Listings in Emerging Buyer Metros
Metros such as Miami, Nashville, Austin, San Antonio, and Houston have tilted heavily in favor of buyers. In these metros, inventory expansion is outpacing contract activity, giving buyers the upper hand.
-
Action Item: Configure MLS and property portal scrapers to flag properties that have surpassed 45 days on market without going under contract. Cross-reference this list with properties that have already cut their asking price. Offer 8% to 12% below the discounted ask, or request a permanent 2-1 temporary rate buydown financed entirely by the seller.
2. Stress-Test Deal Math Across Multiple Interest Scenarios
Underwriting a rental property or commercial repositioning project based solely on current interest rates leaves capital vulnerable to unexpected shifts. If your target deal requires a rate drop to 6.00% to generate positive cash flow, it is a speculative play, not a sound investment.
-
Action Item: Model debt service across two distinct scenarios: an upside case at 6.25% and a stress case at 7.00%. If the asset maintains a minimum 1.20 Debt Service Coverage Ratio (DSCR) and yields acceptable cash-on-cash returns at a 7.00% borrowing rate, you have an inherent safety margin. If the pro forma breaks down at 7.00%, lower your purchase offer until the math balances.
3. Deploy Creative Financing and Seller Carryback Strategies
Many homeowners who purchased or refinanced in earlier low-rate cycles hold existing mortgages with interest rates between 2.75% and 3.50%. When these owners need to sell due to life events, traditional retail buyers cannot assume those loans, and high prevailing rates shrink the buyer pool.
-
Action Item: Present hybrid offers. Alongside a standard discounted cash offer, structure an alternative proposal featuring seller financing, a wrap-around mortgage, or a subject-to structure. For sellers with substantial home equity, a seller second or full carryback note at 5.00% to 5.50% interest delivers better monthly cash flow than traditional bank financing while providing the seller with consistent interest income.
4. Monitor Distressed Pipeline Activity in Sun Belt Hubs
States like Florida, Texas, and Nevada show elevated foreclosure activity alongside mounting insurance premium adjustments. Coastal properties facing climbing windstorm insurance rates and HOA assessment reserves often create sudden financial pressure for property owners.
-
Action Item: Establish automated daily alerts for Notice of Default (NOD) and Lis Pendens filings through county recording databases or specialized services. Connect with local estate attorneys, probate specialists, and title companies to identify off-market acquisition opportunities before properties reach auction stages.
5. Focus on In-Place Cash Flow Over Appreciation Assumptions
Historical appreciation averages across the United States typically range between 3% and 4% annually. Over recent quarters, that metric has compressed to roughly 1.5% to 1.9%. Underwriting deals that rely on 5% to 8% annual appreciation to hit return targets is a risky strategy in this market.
-
Action Item: Calculate equity upside based solely on forced appreciation through renovations, operational efficiencies, or square footage additions. Base rental projections on verified, closed lease comps signed within the last 60 days, and expand your underwriting reserves for vacancies and maintenance by a minimum of 200 basis points.
Frequently Asked Questions (FAQ)
Will the September Fed meeting cause mortgage rates to drop immediately?
Not necessarily. Financial markets trade on forward expectations, which means mortgage rates often price in anticipated Federal Reserve rate decisions weeks before the announcement. The spread between the 10-year Treasury yield and mortgage rates is influenced more by economic projections, labor market updates, and commentary from Fed leadership than by the actual rate decision itself.
How does 3.8 months of supply compare to historic housing cycles?
A 3.8-month supply represents a notable shift toward a balanced market, though it remains slightly below the historical benchmark of 4.0 to 5.0 months. It stands well above the tight conditions seen in earlier seller-dominated years, when many metros operated with fewer than 1.5 months of active inventory. This added supply gives buyers more time to complete due diligence and conduct inspections without losing properties to immediate bidding wars.
Should fix-and-flip investors pause acquisitions until rates drop?
Rather than pausing entirely, flip operators should adjust their underwriting criteria. Build in longer projected hold periods (6 to 8 months instead of 3 to 4 months) to account for longer marketing windows, expand financing contingencies, and focus on entry-level price points where local buyer demand remains deepest.
Navigating the Market Ahead
The late-summer housing market is neither a runaway bull run nor a structural collapse. It is an evolving market defined by expanding inventory, cooling contract activity, and stable, elevated financing costs.
For the average consumer, these market dynamics can feel discouraging. For astute real estate investors, they create opportunity. The rise in active listings to 1.5 million properties and the fact that 20.8% of sellers are reducing prices signal that negotiation leverage has shifted back toward buyers.
Focus your energy on identifying motivated sellers, stress-testing financing assumptions, and underwriting for immediate, verifiable cash flow. The weeks leading up to the September Fed meeting offer an ideal window to lock in favorable pricing and terms before the market pivots into the fall cycle. Run your numbers conservatively, negotiate with confidence, and capitalize on the opportunities this transition provides.