U.S. Home Sales Drop: What August 2026 Means for Investors
Aug 27, 2026
Written by Discount Property Investor Team
Existing-home sales fell 1.7% in July 2026 to a seasonally adjusted annual rate of 4.06 million units, while the national median existing-home sales price climbed 2.0% year-over-year to a record high of $434,100, according to the
This pricing-volume divergence defines the late summer 2026 housing climate. When transaction volume stays locked near historic 30-year lows while closed transaction prices print record highs, retail market participants often freeze. For active real estate entrepreneurs, wholesalers, flippers, and rental portfolio builders, this "low-turn, slow-burn" environment provides a clear blueprint for sourcing off-market discounts, negotiating creative financing terms, and stress-testing pro formas against realistic holding costs.
1. What’s Happening Right Now in the U.S. Housing Market
The U.S. housing market remains locked in a structural standoff between high borrowing costs and constrained active supply.
Three fundamental dynamics characterize the current marketplace:
-
Transaction Stagnation: Buyers relying on conventional agency debt are restricted by strict affordability limits, while existing homeowners remain locked into sub-4% mortgage notes originating from 2020 to 2021.
-
Sustained Nominal Price Resilience: July 2026 marked 37 consecutive months of year-over-year median sales price gains, driven largely by upper-tier asset transactions that skew closed sales averages upward.
-
Contracted Active Supply: Total housing inventory contracted 1.9% month-over-month to 1.54 million units in July 2026, keeping total inventory at an unchanged 4.6-month supply.
The disconnect between nominal closed prices and underlying transaction volume stems directly from the affordability squeeze.
As highlighted in
As a result, first-time retail buyers captured just 29% of transactions in July 2026, falling from 33% in June and remaining significantly beneath the 40% historical average. Meanwhile, all-cash transactions accounted for 26% of all sales, down from 31% a year ago, illustrating that institutional and high-equity buyers are deploying capital with increased selectivity.
2. August 2026 Market Trend Graphs & Comprehensive Data
Visual 1: 2026 Key Market Indicator Shift (Line & Metric Trend)
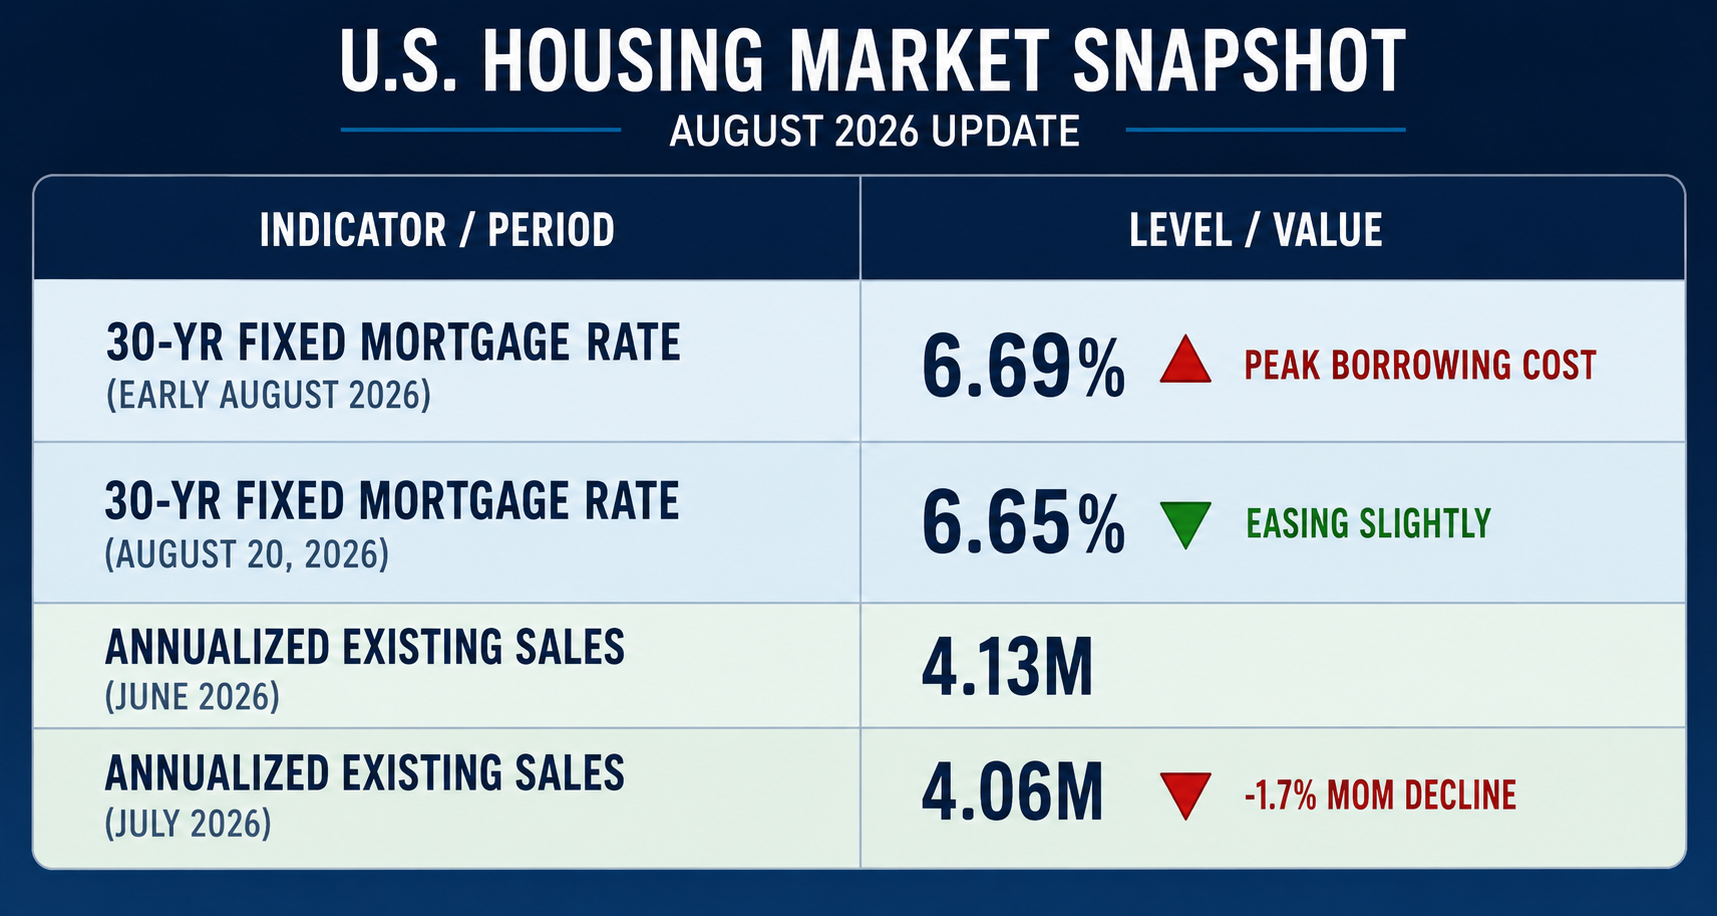
Graph Explanation: This graph highlights how borrowing costs above 6.6% continue to depress annualized transactional turnover, pinning sales volume down to 4.06 million units—matching multi-decade historical lows.
Source: Freddie Mac PMMS & NAR Existing-Home Sales Report
Visual 2: Closed Sales Prices vs. Asking List Prices (Bar Trend)
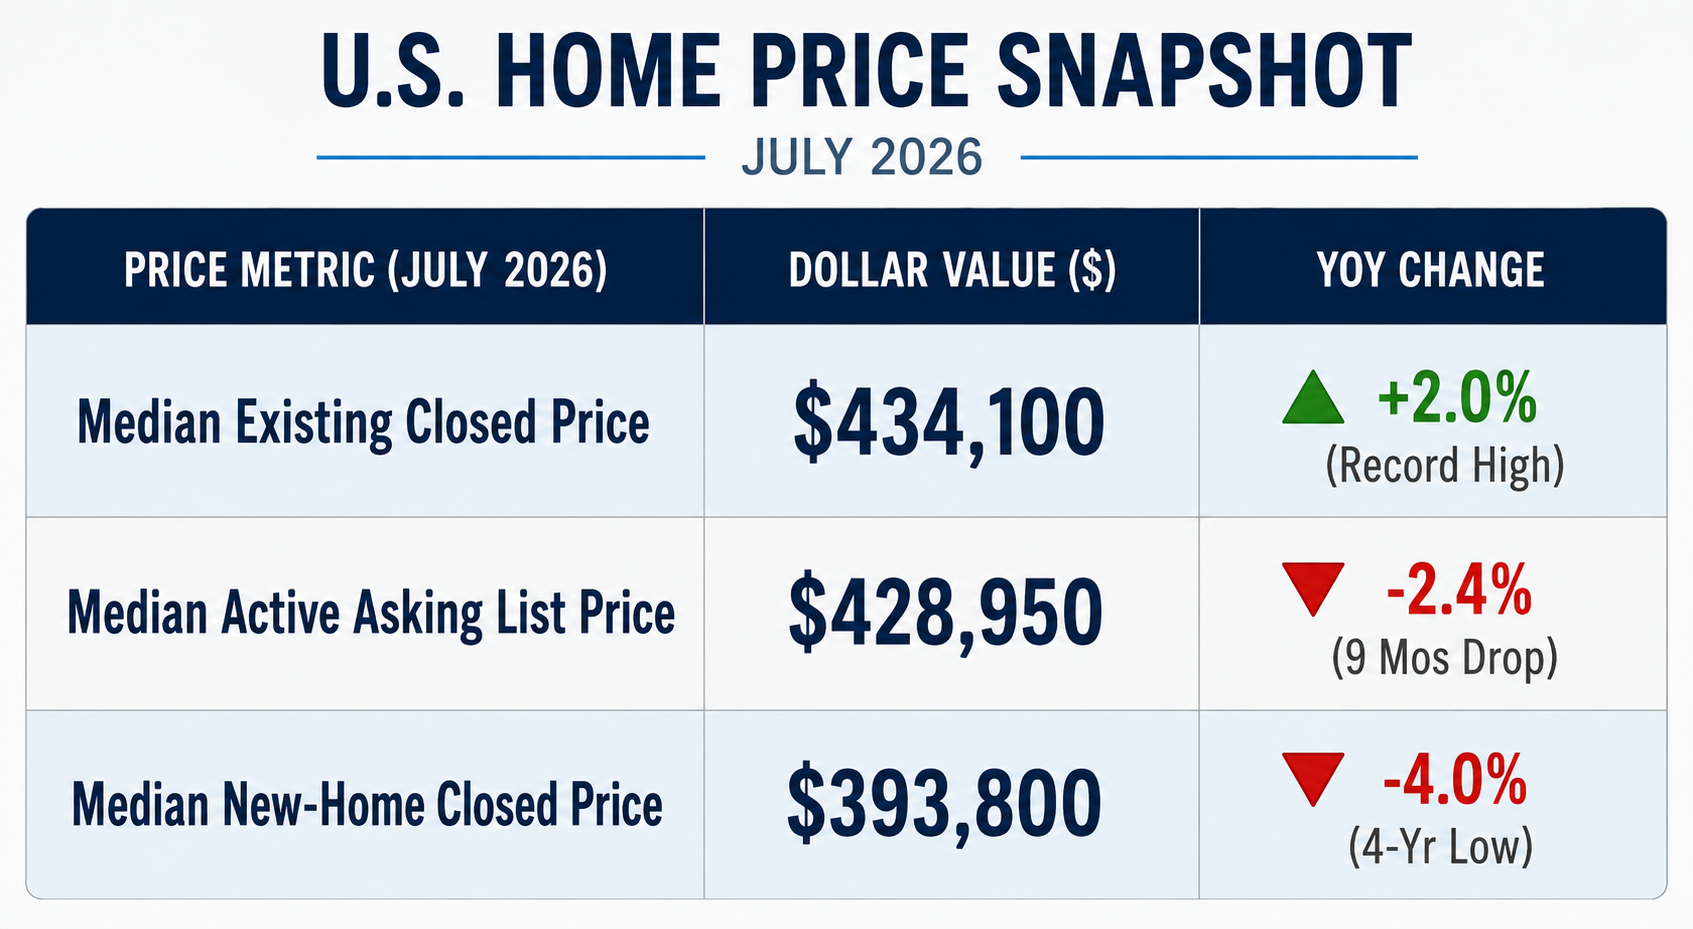
Graph Explanation: While closed median existing sales hit a record ($434,100) due to transaction mix, active list prices fell for the 9th straight month (-2.4% YoY) and homebuilders cut new-home median prices to $393,800 to maintain sales velocity.
Source: NAR Research & Realtor.com July Housing Trends
Visual 3: Regional Sales Pace vs. Median Price Growth
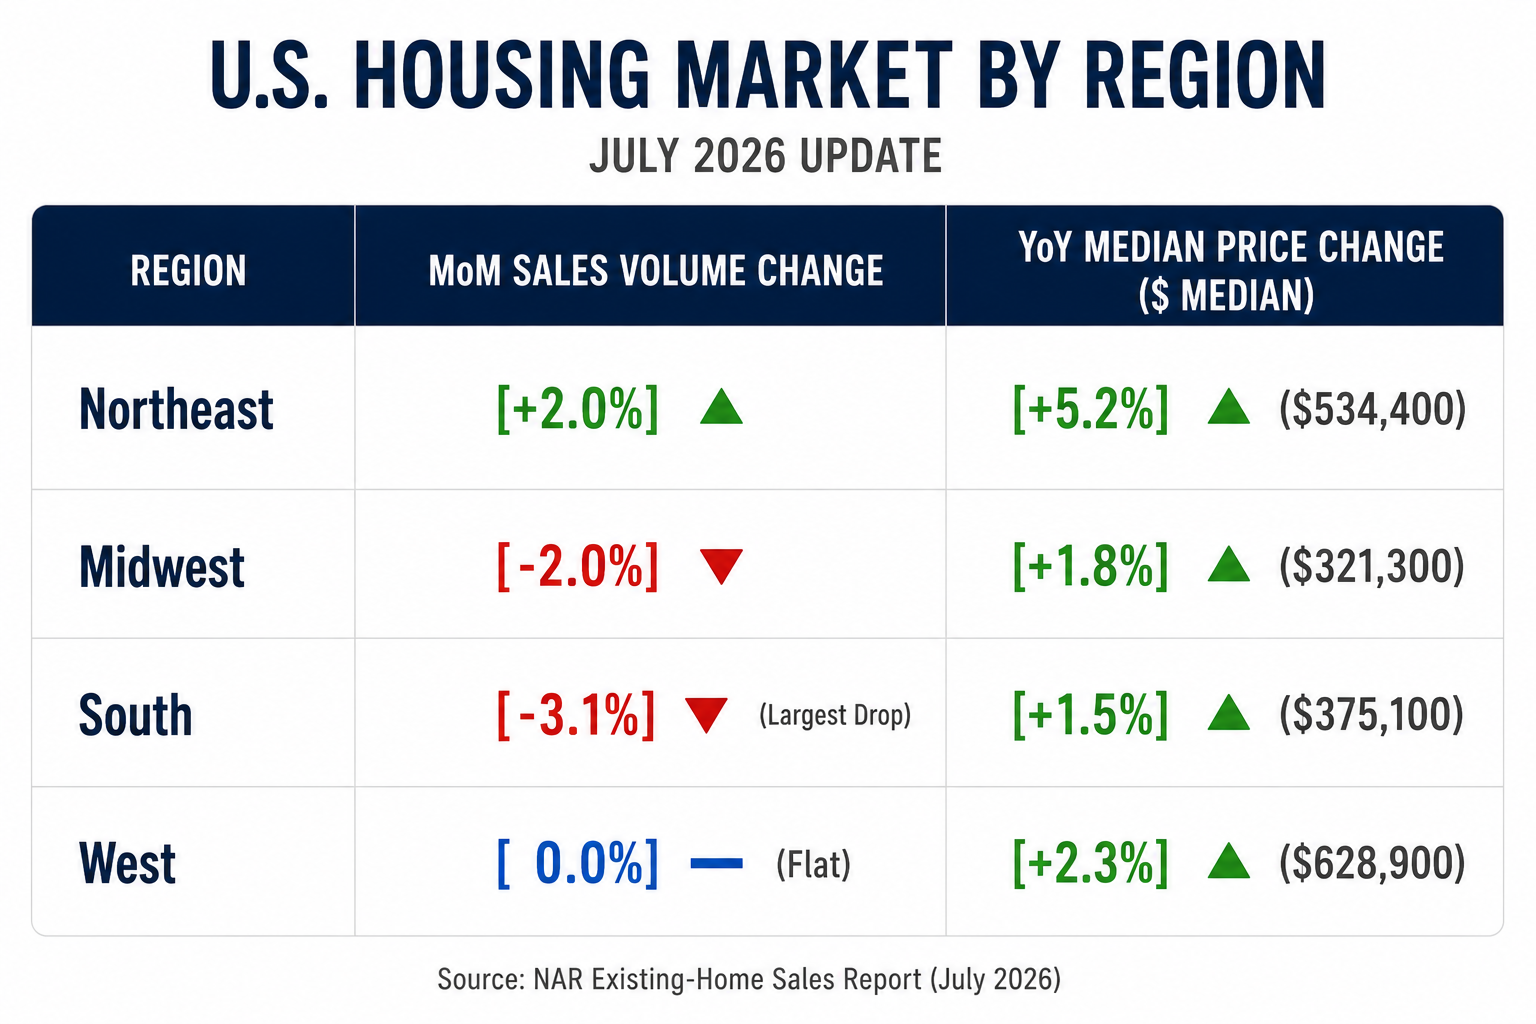
Graph Explanation: Regional markets are diverging sharply. The supply-starved Northeast was the only region to post positive month-over-month sales growth (+2.0%), while the South saw the steepest volume contraction (-3.1%), transferring pricing power back to buyers.
Data Source: NAR Existing-Home Sales Regional Breakdown (Published August 11, 2026)
Comprehensive Market Data Table
| Market Indicator | Prior Data Period | Latest 2026 Data Period | Net Change | Direct Real Estate Investor Impact |
|---|---|---|---|---|
|
Existing-Home Sales Pace |
4.13M (June 2026) |
4.06M (July 2026) |
-1.7% MoM / +0.7% YoY |
Retail buyer pools are shrinking; properties require strategic pricing and terms. |
|
Median Existing-Home Price |
$425,600 (July 2025) |
$434,100 (July 2026) |
+2.0% YoY |
Nominal equity remains high; target asset quality and avoid chasing peak retail comps. |
|
National Active Inventory |
1.57M units (June 2026) |
1.54M units (July 2026) |
-1.9% MoM / -0.6% YoY |
Tight active supply prevents broad price collapses but constrains easy off-market inventory. |
|
Months of Inventory Supply |
4.6 months (June 2026) |
4.6 months (July 2026) |
Unchanged MoM / YoY |
Balanced national market, but localized inventory shifts dictate buyer/seller leverage. |
|
30-Year Fixed Mortgage Rate |
6.69% (Aug 6, 2026) |
6.65% (Aug 20, 2026) |
-4 bps / +7 bps YoY |
High debt service compresses debt-service coverage ratios (DSCR) and maximum allowable offers (MAO). |
|
Active Listing Price Cuts |
18.8% (June 2026) |
20.0% (July 2026) |
+1.2% MoM |
1 in 5 listed sellers are actively reducing prices, signaling rising seller fatigue. |
|
Median Active Listing Price |
$439,500 (July 2025) |
$428,950 (July 2026) |
-2.4% YoY |
9th straight month of listing price contraction; asking prices are reconciling with debt limits. |
|
New Single-Family Home Sales |
678,000 (June 2026) |
607,000 (July 2026) |
-10.5% MoM |
Lowest pace since Jan 2026; homebuilders are discounting new inventory to maintain volume. |
|
Median New-Home Price |
$410,200 (June 2026) |
$393,800 (July 2026) |
-4.0% MoM |
Builder discounting creates comp ceilings for suburban fix-and-flip retail exits. |
|
Multifamily Rent Growth |
1.2% (Q1 2026) |
1.0% (Mid-2026) |
-20 bps |
Flat rent trajectory requires conservative underwriting without speculative rent steps. |
|
National Rental Vacancy Rate |
7.3% (Q2 2025) |
7.3% (Q2 2026) |
Flat YoY |
Stable vacancy suggests rental demand remains steady, but investors should underwrite conservatively by local market. |
Sources: NAR Existing-Home Sales Release (Aug 11, 2026); Freddie Mac PMMS (Aug 20, 2026); Realtor.com July Housing Trends Report (Aug 3, 2026); U.S. Census Bureau / Reuters Housing Summary (Aug 11, 2026).
4. Why This Data Matters for Real Estate Investors
Experienced operators do not evaluate housing metrics in isolation. Market transitions separate passive hobbyists from professional real estate operators.
The Squeeze on Retail Buyer Purchasing Power
When agency borrowing rates hover between 6.50% and 6.70%, conventional end-buyers lose approximately 10% of their borrowing purchasing power for every 100-basis-point increase in mortgage rates. Because median closed sale prices remain elevated ($434,100), the pool of qualified buyers capable of absorbing standard market inventory has contracted.
The Emerging Disconnect Between Asking and Selling Prices
While closed transaction prices printed an all-time high in July 2026,
Sellers who entered the market in late spring with aggressive pricing expectations are confronting higher days on market and buyer hesitation. This opens a clear window for off-market acquisitions, creative finance structuring, and aggressive second-round offer submissions.
The Impact of Builder Concessions on Exit Strategies
Data from the
If you are flipping or wholesaling renovated properties in suburban subdivisions where builders are delivering spec inventory, your renovated retail product must be priced competitively against new homes that come with builder warranties and financing incentives.
5. Regional Divergence: Where the Opportunities Are Located
National housing figures average out significant localized variations. Real estate is inherently local, and the July/August 2026 data shows clear divergence across major geographic regions:
-
The Northeast (Severe Supply Lock): The Northeast was the only region to post positive month-over-month sales growth (+2.0%) alongside a 5.2% year-over-year jump in median price to $534,400. In older suburban metros across New Jersey, Pennsylvania, New York, and Massachusetts, physical land scarcity and a lack of new construction have kept supply constrained. Wholesalers and flippers can command healthy margins on fully renovated turnkey product, but acquisition requires direct-to-seller marketing, as MLS deals feature heavy buyer competition.
-
The Midwest (Affordable Yield and Cash-Flow Stability): The Midwest recorded a modest 2.0% sales dip while maintaining steady 1.8% price appreciation, reaching a median of $321,300. Because home price-to-income ratios in states like Ohio, Indiana, Missouri, and Illinois remain significantly healthier than the national average, the regional buyer pool is less sensitive to mortgage rate fluctuations. This remains a strong environment for long-term buy-and-hold operators and BRRRR investors targeting predictable cap rates and steady tenant occupancy.
-
The South (Supply Influx and Price Sensitivity): The South saw the sharpest sales pullback, declining 3.1% month-over-month, with median price growth moderating to 1.5% ($375,100). Sunbelt markets that experienced high volumes of multifamily deliveries and residential single-family development over the past 36 months (such as parts of Texas, Florida, and Georgia) are seeing inventory climb back above 5.0 months of supply. Buyers hold stronger negotiating leverage here. Wholesalers and flippers must secure wider acquisition margins to account for extended marketing times, while rental operators should underwrite concessions such as one month of free rent or covered utility fees.
-
The West (High-Price Equilibrium): Western sales held flat month-over-month, with median prices rising 2.3% to $628,900. Affordability constraints are most pronounced here, keeping entry-level buyers on the sidelines while high-equity owners drive the majority of closed transactions. Mid-tier fix-and-flip plays require strict margin control. Creative acquisition strategies, including subject-to existing financing and seller second mortgages, are particularly effective for solving seller equity challenges in high-balance markets.
6. Strategy Playbooks by Investor Experience Level
What Beginner Investors Should Focus On
-
Eliminate "Appreciation Speculation" from Underwriting: Base deal profitability entirely on existing, realized comps closed within the last 60 to 90 days. Do not assume home prices or market rents will rise by 3% to 5% annually to make your pro forma work.
-
Focus on the 34-Day Seller Motivation Trigger: Data indicates that the median timeframe for a seller to issue their first price reduction has dropped to 34 days on market (down from 38 days last year). Beginners should build an automated daily search filtering for properties between 30 and 45 days on market with no active pending contracts.
-
Avoid Thin-Margin Flips: If a deal requires a 10% market price increase over your holding period to deliver a 15% return on capital, pass on the opportunity. Target fix-and-flip margins with a built-in equity cushion of at least 20% to 25% after factoring in full debt service, transfer taxes, and realistic sales commissions.
What Seasoned Investors Should Watch & Optimize
-
Audit Private Lending Rates & Holding Costs: With rates holding between 6.50% and 7.00%, hard money debt service can erode profits during extended permitting or contractor delays. Re-negotiate terms with private capital partners—such as offering equity participation or interest-only deferred structures—to protect operational liquidity.
-
Stress-Test Rental Cash Flow Against Low Rent Growth: National multifamily rent growth slowed to 1.0% annualized by mid-2026, while rental vacancy rates leveled at 7.3%. Model rental acquisitions with flat income growth across years one and two, alongside 4% to 6% annual increases in municipal property taxes and insurance premiums.
-
Expand Into Creative Acquisition Structures: With 26% of transactions closing via cash and institutional buyers remaining selective, traditional wholesale assignments can stall if end-buyers lack liquidity. Position your pipeline to offer sellers hybrid exit strategies, including wrap mortgages, novation agreements, and seller-carried second notes to bridge valuation gaps.
7. Real-World Problem Solving
Problem 1: "Sellers keep rejecting my cash offers because their expectations are anchored to peak retail pricing."
-
Why It Happens: Headlines tout record median sales prices ($434,100), leading sellers to ignore market stagnation and buyer financing limits.
-
How to Diagnose It: Compare the subject property's DOM against local averages and check how many competing neighborhood listings have cut prices (national average: 20.0%).
-
What to Change: Stop presenting single "take-it-or-leave-it" discount cash offers. Present a two-tier offer structure: Cash Discount vs. Full Asking via Structured Seller Financing.
-
Next Action: Script your next seller conversation:
"Mr. Seller, I completely understand why you want to achieve $430,000. When looking at peak remodeled comps, those numbers were achieved. However, with buyers facing 6.65% interest rates, properties needing updates are sitting for 45+ days, and 1 in 5 sellers is actively cutting prices. I can purchase the home as-is with a guaranteed 14-day cash close at $345,000, or I can pay you your full $420,000 valuation if you are open to structured monthly installment terms at sustainable debt service. Which option better fits your timeline?"
Problem 2: "My fix-and-flip exit is sitting on the market longer than projected, eating profits in carry costs."
-
Why It Happens: Conventional buyers are hitting an affordability ceiling; new-construction builders are offering 5.5% rate buydowns that draw away retail traffic.
-
How to Diagnose It: High showing volume paired with zero submitted contracts indicates that buyers love the property but cannot qualify for the monthly debt service.
-
What to Change: Instead of a simple $15,000 price drop, allocate $10,500 toward a temporary 2-1 interest rate buydown for the retail buyer.
-
Next Action: Update MLS remarks: "Seller Offering Concession for 2-1 Rate Buydown – Lower Your Year 1 Payment by $498/Month!"
-
Cost Comparison: A $15,000 price drop on a $425,000 home saves the buyer only $84/month at 6.65%. A 2-1 buydown saves the buyer $498/month in Year 1 while costing the seller only $10,500 in concessions.
-
8. Investor Implementation Action Plan
To capitalize on late 2026 market conditions, adjust your operations across four key areas:
-
Recalculate Max Allowable Offers (MAO): Update your baseline formula. Account for a minimum 120- to 150-day average holding cycle on fix-and-flips to absorb current marketing timelines without eroding projected returns.
-
Target Stalled MLS Listings with Systematic Follow-Up: Set an automated filter in your CRM or MLS feed for properties crossing the 34-day DOM mark with recent price drops. Contact listing agents with clean, proof-of-funds cash offers featuring short inspection contingencies (5 to 7 days) and flexible closing windows.
-
Audit Your Refinance Assumptions on BRRRR Deals: Ensure your long-term takeout debt calculates debt-service coverage ratios (DSCR) using realistic exit rates (6.75%–7.25%) rather than speculative future rate cuts. If a property does not cash-flow under current debt constants, restructure the entry acquisition price.
-
Deploy Financing Solutions to Motivated Sellers: For sellers with low existing mortgage balances or free-and-clear properties who reject wholesale discounts, present structured terms (such as hybrid seller-financing notes at 4%–5% interest) that meet their target purchase price while maintaining positive operational cash flow.
Key Takeaways for August 2026
-
Sales Volume Remains Compressed: Existing-home sales sit at a 4.06 million annualized rate, matching multi-decade cyclical lows as borrowing costs keep retail buyers payment-constrained.
-
Closed Prices Show Historic Resilience: The median existing-home sale price reached $434,100 (up 2.0% year-over-year), driven by high-equity transactions and an aggregate housing inventory that remains tight at 1.54 million units (4.6 months of supply).
-
Asking Prices and New Builds Are Softening: Active listing price reductions climbed to 20.0% of the market, national median list prices dipped 2.4% year-over-year, and new-home median prices fell to $393,800, creating discount acquisition windows for disciplined buyers.
-
Regional Nuances Dictate Strategy: The Northeast remains supply-constrained and competitive; the Midwest offers balanced, affordable rental yields; and the South continues to absorb larger volumes of active inventory, shifting negotiating leverage toward buyers.
-
Execution Beats Speculation: Successful investors in late 2026 win by underwriting conservative holding costs, using seller-paid rate buydowns on exits, and offering creative financing terms to motivated sellers.
The real estate market in late 2026 isn't experiencing an indiscriminate crash—it is an affordability-driven, inventory-selective market that rewards disciplined underwriting and structured deal execution.
Your objective as an investor is to learn the macroeconomic variables driving current data, apply stricter underwriting rules, test creative offer structures with fatigued sellers, improve your negotiation frameworks, and scale your acquisitions on sound fundamentals.
Take an honest look at your current pipeline: Which active deals require an underwriting adjustment, and what new offer strategies can you put in front of motivated sellers this week?
Need to Sell Fast? Skip the Listing Process With House Sold Easy
Everything above assumes you have the time and flexibility to price strategically, refresh photos, wait through a showing cycle, and negotiate concessions — and for most sellers, that's still the right approach. But if reading through all of this makes a traditional listing sound like more time, uncertainty, and price-cutting than you're willing to take on, there's another path.
At House Sold Easy, we buy houses directly for cash — no listing, no showings, and no waiting on a buyer's mortgage financing to come through in a market where rates are still hovering near 6.67%. That matters right now: with over 100,000 listings carrying price cuts in a given week and homes taking longer to find a buyer, a traditional sale can mean weeks of open houses and negotiation before you even get to a closing date. We make a fair cash offer, work around your timeline, and can close in as little as a few days — as-is, with no repairs to make and no agent commissions to pay.
Whether you're facing a tight deadline, handling an inherited property, or you'd simply rather not navigate today's slower, more negotiation-heavy market, get a no-obligation cash offer from House Sold Easy and see what a simpler sale looks like.
The lesson isn't that the sellers "lost" $16,000 off their original ask. It's that the original ask was never realistic, and recognizing that early — rather than after two more months of an empty calendar — is what got the home sold.