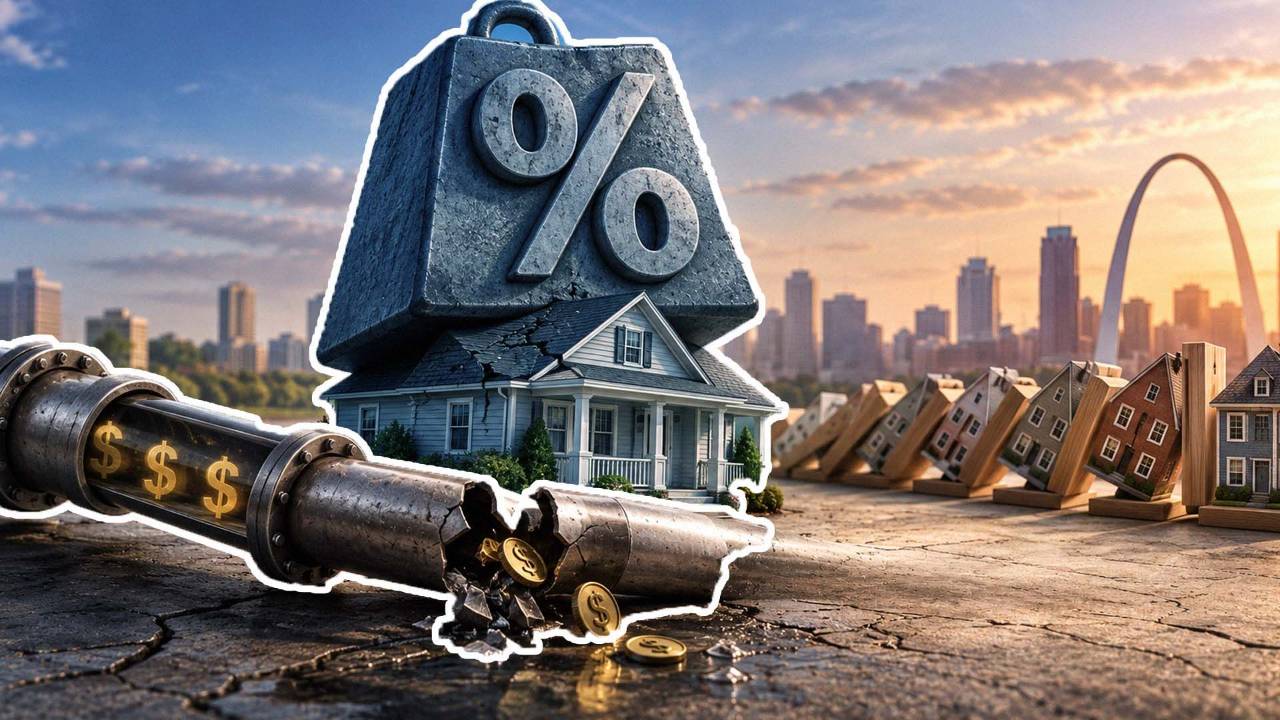
7.03% Mortgage Rates: What U.S. Housing Investors Should Know
Sep 25, 2026
Written by Discount Property Investor Team
If you checked mortgage rates this week and felt your stomach drop a little, you weren't alone. The 30-year fixed crossed 7% on Thursday for the first time in well over a year, and it did it fast. For investors in St. Louis, whether you're buying your first rental in Tower Grove South, flipping in South County, or running a wholesale operation out of North City, this is one of those weeks where the numbers actually change how you should be making offers.
We're going to walk through what happened, why it happened, what the national sales and inventory data are saying, and then bring it all home to the St. Louis market. We'll finish with some practical moves for beginner and seasoned investors, wholesalers, and BRRRR folks. No doom, no hype. Just what the data says and what we'd be doing with it.
The short version
- Freddie Mac's 30-year fixed average hit 7.03% on Sept. 24, 2026, up 0.27 points in two weeks.
- Pending home sales nationally are down 4.7% year over year, and the Midwest is down a little more than that.
- National inventory climbed to 1.62 million homes, the most since late 2019.
- In St. Louis, prices are still rising, but listings are sitting longer, and sellers are cutting asking prices. That's where negotiation opportunities live right now.
What actually happened with mortgage rates this month
Let's start with the headline number. On September 24, Freddie Mac's weekly survey showed the 30-year fixed-rate mortgage averaging 7.03%, up from 6.95% the week before and well above the 6.30% average from a year ago. The 15-year didn't escape either. It rose to 6.42%.
That 7% line matters mostly for psychological reasons, but psychology moves markets. According to NPR, this is the first time the benchmark rate has topped 7% in 20 months, going all the way back to January 2025. Buyers who spent the last year and a half telling themselves "at least it's not 7" just lost that comfort.
What makes this jump stand out is the speed. Two weeks earlier, on September 10, the same Freddie Mac survey had the 30-year at 6.76%. Then it jumped to 6.95% on September 17, and then to 7.03%. That's a 0.27-point climb in fourteen days. And as one industry roundup pointed out, the rate has now gone up for five weeks in a row.
30-year fixed mortgage rate, weekly average (Freddie Mac PMMS)
Source: Freddie Mac Primary Mortgage Market Survey, via FRED, Federal Reserve Bank of St. Louis. Weekly averages for borrowers with strong credit and 20% down. Your actual quote will likely be different.
One thing we always remind people: Freddie Mac's number is a weekly average for borrowers with great credit and 20% down. Daily trackers tend to run hotter. Mortgage News Daily's index hit 7.37% on Thursday, which Yahoo Finance noted was the highest reading since May 2024. So if your lender is quoting you something north of 7.2%, that's not them being greedy. That's the market this week.
Why rates jumped so fast
Mortgage rates don't follow the Fed's rate directly. They mostly follow the 10-year Treasury yield, and that yield has been climbing hard. U.S. News reported that 10-year yields pushed to their highest level since 2007 heading into the Fed's September meeting, as bond traders started pricing in a rate hike.
Why would the Fed be thinking about hiking instead of cutting? Inflation, mostly, and energy prices are a big piece of that. Yahoo Finance tied the Treasury surge to growing investor worry about oil prices, inflation, and future Fed hikes. NPR went further, noting that rates have climbed more than a full percentage point since the U.S. conflict with Iran began.
Inman's read on where this goes next isn't comforting for borrowers. Their Sept. 24 coverage says rates are expected to keep climbing as Treasury yields rise and a Federal Reserve hike in October looks likely. They also made a point that's worth underlining for investors: the broader economic pressure could slow fall home sales and shift leverage toward homebuyers.
Read that last part again if you're an investor. Leverage shifting toward buyers is exactly the environment where people who have cash, creativity, or patience tend to do well.
Home sales are slowing, but not collapsing
Here's where the picture gets more interesting than "rates up, market bad." Buyers haven't disappeared. They've just gotten pickier and slower.
Pending sales: down 4.7% from last year
Pending sales are signed contracts that haven't closed yet, so they're a good early warning signal. In the latest report, the National Association of REALTORS® said pending home sales ticked up 0.3% from July to August but were down 4.7% compared to a year earlier, with every region of the country lower than last year.
That tiny monthly bump surprised some economists. Reuters noted that forecasters had actually expected a 0.6% decline, and the gain is likely to be temporary as higher rates keep some buyers on the sidelines. Keep in mind those August contracts were signed when rates were in the 6.6% to 6.7% range. September's contracts are being written at 7%, so we'd expect the next report to look softer.
For the bigger picture, NAR chief economist Lawrence Yun put it plainly: contract signings nationally are running about 30% below where they were in the years before the pandemic.
The Midwest is feeling it a bit more
This is the part St. Louis investors should pay attention to. The Midwest was one of only two regions to slide month over month. HousingWire reported that pending sales fell 1.6% in the Midwest from July to August, and NAR's regional breakdown shows the Midwest down 4.9% year over year, a touch worse than the national number.
Yun's explanation is interesting. According to Inman, he linked the steeper drops in the Northeast and Midwest to those regions posting the fastest home price growth in August. In other words, Midwest homes got more expensive faster than buyers' budgets could keep up, and then rates piled on top. That lines up with what we're seeing on the ground here in St. Louis, which we'll get into below.
It's not all soft in our part of the country, though. Two nearby metros made NAR's list of the biggest year-over-year gainers: Memphis at +6.4% and Cincinnati at +4.7%. Affordable river cities with solid rental demand are still attracting buyers. That's a useful reminder that "the Midwest" isn't one market.
Closed sales dipped below 4 million
On the closed-sales side, existing-home sales fell 2.0% in August to a seasonally adjusted annual pace of 3.98 million, down 1.2% from a year earlier. HousingWire noted Midwest closings dropped 3.1% for the month to a 940,000 annual rate.
But prices didn't crack. The national median existing-home price rose 1.6% year over year to $429,100. Yun pointed out that sales are actually up 1.6% year to date through August, and he attributed the August dip to borrowing costs rather than a collapse in demand.
That's the important nuance. Fewer deals, still-rising prices. It's a slow market, not a crashing one.
Inventory hit 1.62 million, and that's the real story for investors
If the rate headline is the bad news, inventory is the part that opens doors. NAR reported total housing inventory at 1.62 million units in August, the first time since November 2019 that it's topped 1.6 million. The National Association of Home Builders' Eye on Housing blog added that inventory was up 3.2% from July and 5.9% from a year ago.
At the current sales pace, that's a 4.9-month supply. Yun didn't sugarcoat what it means: he called it the highest months' supply in over ten years and said the ample inventory gives homebuyers better opportunities to negotiate.
More homes sitting longer, with buyers who have to think twice about their payment, is how negotiating power shifts. It doesn't happen overnight, but it's happening.
For a lot of investors, especially anyone who started after 2020, this is the first time they've seen supply build like this. For the last few years, you either paid asking (or more) or you didn't get the house. When inventory builds, and financed buyers get squeezed, sellers start listening to offers they would have laughed at in 2022.
Bringing it home: what this looks like in St. Louis
National numbers are useful, but nobody buys a "national" house. Here's how the rate spike and inventory build are landing across the St. Louis area.
Local rate quotes are already above 7.2%
Locally, St. Louis Real Estate News reported that as of September 24, the 30-year fixed rate St. Louis buyers are seeing climbed to 7.26%, with the 15-year at 6.87% (those figures come from Mortgage News Daily's daily index). The same report noted that sellers may see softer demand, longer listing times, and a need to adjust pricing strategy.
St. Louis prices are still climbing, which surprises a lot of people
Here's what makes St. Louis different from some of the markets you read about in national headlines. Prices here are still going up, and in some pockets, going up fast.
Across the region, the St. Louis MSA posted an August median sold price of $305,000, up 6.09% from $287,500 a year earlier. And volume held up better than you might expect. Through the end of August, 23,643 homes had sold across the metro, about 4.07% more than the same stretch of 2025.
St. Louis County is where it gets really interesting. The county's August median sold price hit $325,000, a 12.11% jump over last August. But at the same time, the median list price fell 17.24% to $240,000, and the number of sales dropped 10.80% to 1,173 homes.
Think about what that means. The homes that are selling are the good ones, the updated houses in strong school districts that buyers will stretch for even at 7%. Meanwhile, a lot of what's listed is priced lower and moving slower. That gap between "what's listed" and "what's closing" is where a big chunk of investor opportunity sits.
The City of St. Louis tells a different story. In the latest city update, July's median sold price came in at $235,000, down 5.51% from a year earlier, while sales jumped 16.79% to 306 homes. Lower prices and more transactions usually mean a market where deals are getting done, often with investors and first-time buyers doing the buying. Across the river, the Metro East's August median sold price was $216,000, up 5.37% year over year.
St. Louis area vs. national snapshot, late summer 2026
| Market | Latest month | Median sold price | Price vs. last year | Sales vs. last year | What it tells investors |
|---|---|---|---|---|---|
|
United States |
Aug 2026 |
$429,100 |
+1.6% |
−1.2% |
Slow but stable. Inventory at 1.62M gives buyers room to push back. |
|
St. Louis MSA |
Aug 2026 |
$305,000 |
+6.09% |
+4.07% YTD |
Still appreciating well above the national pace. Healthy demand overall. |
|
St. Louis County |
Aug 2026 |
$325,000 |
+12.11% |
−10.80% |
Two-track market. Top homes sell; list prices are falling on the rest. |
|
City of St. Louis |
Jul 2026 |
$235,000 |
−5.51% |
+16.79% |
More deals at lower prices. Active ground for rentals and rehabs. |
|
Metro East (IL) |
Aug 2026 |
$216,000 |
+5.37% |
n/a |
Lowest entry price in the region, still gaining value. |
Sources: NAR Existing-Home Sales (Sept. 10, 2026); St. Louis Real Estate News monthly market updates using MORE, REALTORS® data (Aug. 31 to Sept. 20, 2026). City of St. Louis figure is the most recent month published. MSA sales figure is year-to-date through August.
What 7% actually costs a St. Louis buyer
Let's put real dollars on this, using a St. Louis-sized house instead of a national one. Take a home at the metro median of $305,000 with 20% down, which leaves a $244,000 loan. At 6.76% (two weeks ago), principal and interest runs about $1,584 a month. At 7.03%, it's about $1,628. At the 7.26% local daily rate, it's roughly $1,666. Compare that to last September's 6.30% average, and the payment was about $1,510.
So in two weeks, the payment went up about $44 a month. In a year, it's up somewhere between $118 and $156 depending on which rate you use. Over 30 years, that $118 alone adds up to more than $42,000. For context on larger loans, Mortgage Daily calculated that at 7.03%, a $400,000 loan costs $2,669 a month in principal and interest, compared with $2,476 a year ago at 6.30%.
That monthly gap is exactly why retail buyers are hesitating, and it's why sellers of homes that need work are starting to feel the pressure first. A buyer who's already stretching to afford the payment isn't also going to budget for a new roof and a furnace.
What this means for different kinds of investors
Rate spikes don't hit every investor the same way. Here's how we'd think about it depending on where you sit.
If you're a beginner investor
Honestly, this can be a better time to start than 2021 was, even with higher rates. Back then, you were competing with 15 other offers and waiving inspections. Now you have time to actually look at a property, get a real inspection, and negotiate.
A few things we'd tell a new investor in St. Louis right now:
- Underwrite at today's rate, not the rate you hope for. A lot of people buy on the assumption they'll refinance in a year when rates drop. Maybe they will. But Inman's reporting suggests the near-term direction could still be up. If a rental only works at 6%, it doesn't work.
- Start with the numbers St. Louis is known for. Our region's big advantage has always been affordability. With a metro median around $305,000 and city homes selling in the $235,000 range, you can still find properties where rents cover the payment with a reasonable down payment. That's getting rare nationally.
- Don't chase the hottest zip codes. The St. Louis County data shows that top-tier homes are still selling at strong prices. Those aren't where beginners find margin. Look at solid, older neighborhoods where homes need cosmetic work, not structural rescue.
If you're a seasoned investor
You've seen cycles before. You know that when financed buyers pull back, cash and speed become worth more. This is when your relationships with agents, wholesalers, and property owners start paying off again.
- Look at listings that have gone stale. St. Louis County's median list price dropping more than 17% while sold prices climbed tells you a lot of sellers overpriced, sat, and cut. Homes that have been on the market 45 days or more with at least one price reduction are prime for a real conversation, not a lowball insult, but a fair offer backed by comps.
- Watch your existing portfolio's debt. If you have adjustable-rate loans or balloon notes coming due in the next 12 to 18 months, run the numbers at 7.5% now. You'd rather plan for that than get surprised by it.
- Consider shorter holds on flips. Every month you hold a rehab at a higher cost of capital eats into profit, and resale buyers are more payment-sensitive than they were in spring. Tighten your timelines and price to sell, not to "test the market."
If you're a wholesaler
Rising rates are a double-edged sword for wholesalers. On one side, motivated sellers get more motivated. A homeowner with a dated house that's been sitting for two months, watching buyers walk away because of payment shock, is a lot more open to a clean cash offer than they were last spring.
On the other side, your end buyers' math just got tighter. Rehabbers who use hard money or bridge loans are paying more to borrow, and landlords using financing need more cushion to make rents cover the payment. That means your assignment spread needs to leave more room than it did a few months ago.
- Re-run your buyer's numbers, not just yours. If your investor list is used to buying at a certain percentage of ARV, expect that number to slide a bit lower. Contract accordingly, or you'll end up with deals you can't assign.
- Target the slow lane. In St. Louis, the homes that are lingering are usually the ones with deferred maintenance, awkward layouts, or unrealistic original pricing. Those are the sellers who need a solution a retail buyer can't provide, and that's where wholesalers add real value.
- Be honest with sellers. The best wholesalers we know in this market lead with the data. Showing a seller that county list prices have dropped sharply while only move-in-ready homes are getting top dollar is a lot more convincing, and more respectful, than a pressure pitch. If you're running the BRRRR method: buy, rehab, rent, refinance, repeat. The strategy depends on that refinance step, and that's the step rates hit hardest. When you refinance a St. Louis rental at 7% or higher, and investor loans generally price above the owner-occupant averages you see in the headlines, your cash-out amount and your monthly cash flow both shrink. A deal that would have pulled most of your money back out at 6% might now leave a meaningful chunk trapped in the property.
Here's how we'd adjust:
- Buy deeper. The only lever you fully control is your purchase price. With inventory building and sellers of rough properties feeling the squeeze, there's room to negotiate harder on the front end. That's the way BRRRR still works in a 7% world.
- Stress test the refinance. Model the refi at a rate a full point above today's. If the deal still cash flows, great. If it only works if rates drop, you're speculating on rates, not investing in real estate.
- Lean on St. Louis rents. Our market's rent-to-price ratio is still one of the better ones among large metros, especially in the city and inner-ring suburbs. That's the cushion that lets BRRRR survive higher rates here when it's basically dead in pricier coastal markets.
- Be ready to hold longer before you refi. Some investors are choosing to sit on their bridge or private financing a little longer, betting that rates ease in 2027. That's a reasonable call if your short-term debt allows it, but it's still a bet. Know your exit if it doesn't happen.
How to actually use this negotiating window in St. Louis
"Negotiation opportunity" is easy to say. Here's what it looks like in practice right now.
- Ask for concessions, not just price cuts. A seller who won't drop the price another $10,000 might agree to cover closing costs or buy down your rate. With rates above 7%, a rate buydown can be worth more to your monthly cash flow than a straight price reduction.
- Use days on market as your opening line. A home that's been listed for 60 days in a market where the good stuff goes under contract in about a week has a story. Ask the listing agent what it is. You'll often learn the seller has already bought elsewhere or has a deadline.
- Write clean offers. In a slower market, a cash or pre-approved offer with a reasonable inspection period and a firm closing date stands out. Sellers who've had deals fall through because a buyer's financing couldn't handle a rate jump will value certainty.
- Know your neighborhoods cold. The St. Louis market is really a bunch of micro-markets. A price that's aggressive in one part of St. Louis County might be fair in another. Pull your own comps from the last 90 days, not the last year, because conditions changed a lot between spring and now.
What to watch over the next few weeks
This situation is moving fast, so here are the dates and data points we'll be tracking:
- The October Fed meeting. If the Fed hikes, as Inman's reporting suggests is likely, rates could push higher still. If the Fed signals it's holding, some of the pressure on the 10-year yield might ease.
- Freddie Mac's Thursday numbers. Every Thursday, the Primary Mortgage Market Survey drops a new weekly average. If you want to watch the trend yourself, the St. Louis Fed's FRED database charts the full weekly history going back to 1971, which is a nice hometown resource.
- September home sales. NAR's next existing-home sales and pending sales reports will be the first to reflect contracts signed with 7% rates. Expect softer numbers.
- Local monthly updates. St. Louis Real Estate News publishes county-by-county updates each month from MORE, REALTORS® data. The October updates will show whether St. Louis County's price strength holds up or starts to crack under higher rates.
The bottom line
Mortgage rates at 7.03% aren't the end of the world, but they do change the game. Nationally, sales are slower, pending contracts are down 4.7% from last year, and inventory has built to its highest level since 2019. That combination is shifting leverage away from sellers, especially sellers of homes that need work.
St. Louis sits in an interesting spot. Prices are still rising here faster than the national average, and well-kept homes in strong areas are still selling. But underneath those headline numbers, list prices are falling, sales in St. Louis County are down double digits, and properties that need work are sitting. For investors who do their homework, underwrite conservatively, and negotiate with real data, fall 2026 could turn out to be one of the better buying windows St. Louis has had in years.
Just don't buy on hope. Buy on numbers that work at today's rate.
Own a St. Louis property that's been sitting?
If you're a homeowner or landlord watching buyers walk away because of rates, you don't have to keep cutting your price and waiting. Our House Sold Easy Service offers a straightforward way to sell your St. Louis area property as-is, with no repairs, no showings, and a closing date that works for you.
And if you're an investor looking for deals in this market, we'd love to talk too.