U.S. Real Estate Market Analysis & Investor Guide (Sept 2026)
Sep 12, 2026
Written by Discount Property Investor Team
A notable shift has unfolded across the United States housing market as of the second week of September 2026: the balance of leverage is moving steadily toward buyers and well-capitalized investors. For nearly four years, prospective home purchasers and real estate operators faced intense inventory starvation and aggressive bidding conditions. Today, market friction has reversed course. The primary challenge is no longer finding properties available for purchase; it is navigating the pricing gap between sellers clinging to yesterday’s valuations and buyers restricted by borrowing costs.
Recent housing and macroeconomic updates clarify this dynamic. According to Freddie Mac's weekly mortgage rate report released September 10, 2026, the 30-year fixed-rate mortgage averaged 6.76%, ticking up from 6.71% the prior week. In tandem, the National Association of REALTORS® existing-home sales report published September 10, 2026 revealed that August existing-home sales dropped 2.0% month-over-month to a seasonally adjusted annual rate (SAAR) of 3.98 million units. Unsold inventory expanded 3.2% to 1.62 million units, pushing national housing supply to 4.9 months—the highest reading in a decade.
Simultaneously, Redfin's market report published September 10, 2026, showed that 59.5% of homes sold below their original asking price in August. Total homes for sale climbed 3.9% month-over-month to 1,534,918, while new listings jumped to a four-year high.
U.S. Months' Supply of Unsold Existing Homes (August 2025 – August 2026)
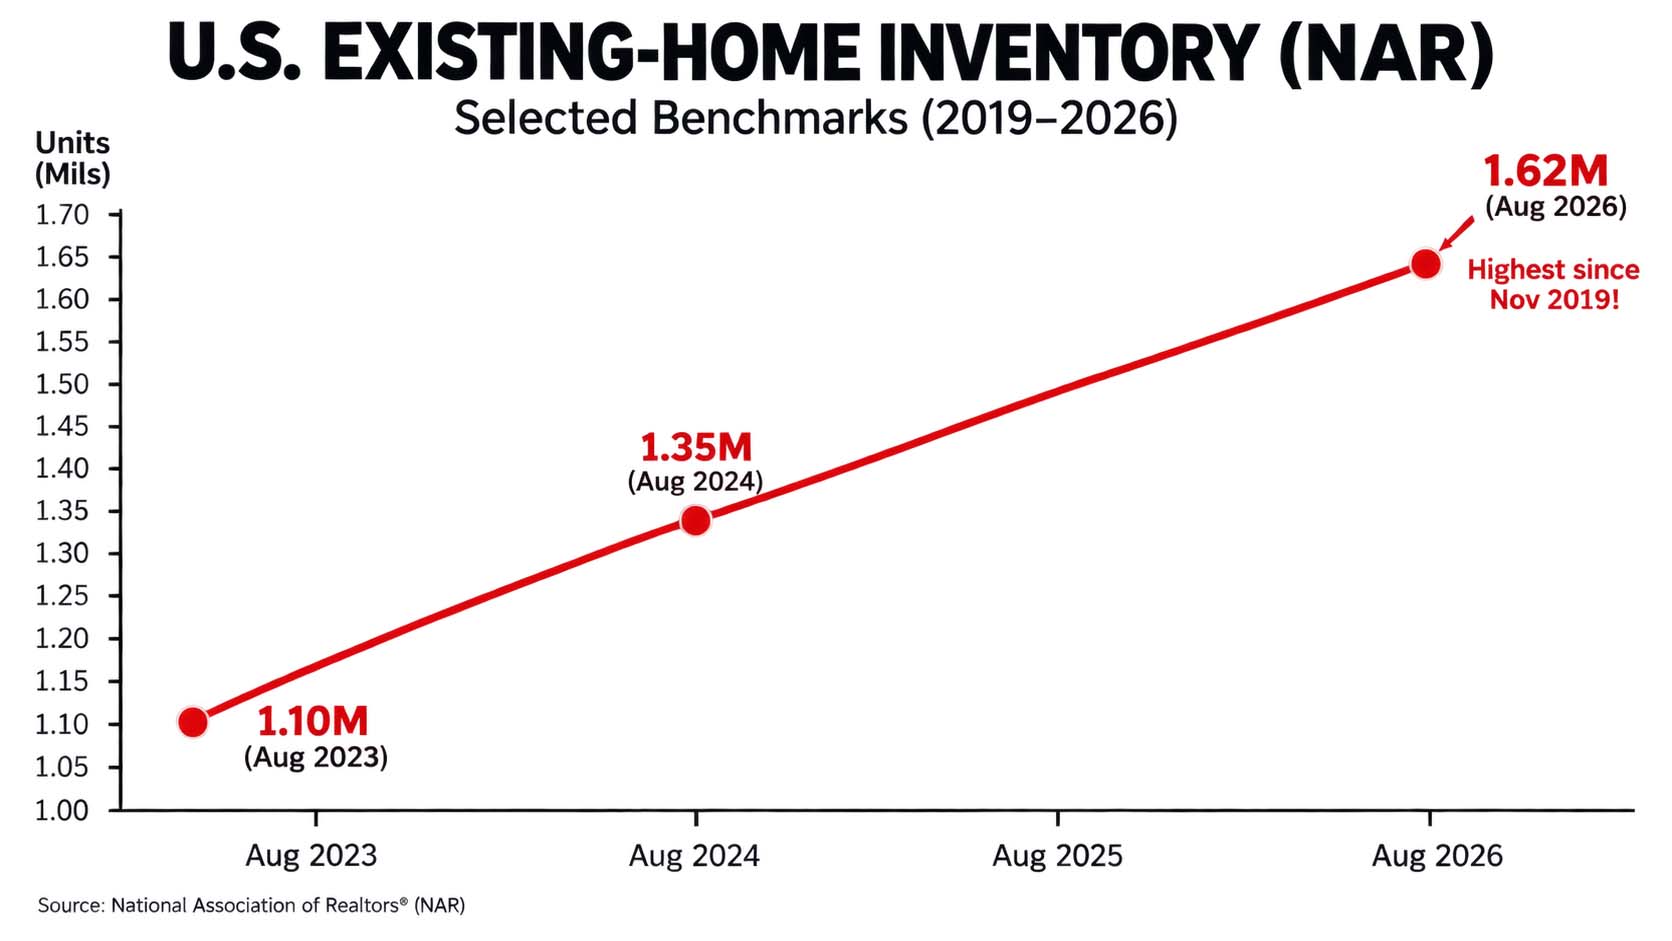
Key Takeaway: Housing inventory expanded to 4.9 months in August 2026—up from 4.6 months in July and 4.6 months in August 2025—establishing the most generous supply buffer seen in over a decade and approaching the traditional 5.0 to 6.0 month balanced mark.
This trajectory in months of inventory reflects the intersection of subdued demand and building supply. Because the pace of sales slowed to 3.98 million annualized units while active inventory accumulated to 1.62 million homes, properties are lingering longer on the market. For investors and buyers, supply moving toward 5.0 months indicates that bidding wars are becoming localized exceptions rather than the national baseline.
Sellers who need liquidity before the late autumn and winter slowdown are discovering that market power has migrated. The era of pricing ahead of the market and expecting unconditional buyer waivers has ceased across most American metros.
Current Macro Drivers: Mortgage Rates, Inflation, and Employment
Understanding transaction outcomes requires examining debt availability and household balance sheets. As reported by Freddie Mac's Primary Mortgage Market Survey , the 30-year fixed-rate mortgage average rose to 6.76% as of September 10, 2026, while the 15-year fixed mortgage moved to 6.09%.
Long-term yields remain sensitive to persistent economic crosscurrents. The Federal Reserve's monetary stance continues to prioritize anchoring core inflation without unnecessarily breaking labor market health. Although consumer price indexes have moderated closer to target bands than in prior years, stubborn service and shelter components keep the Fed funds rate restrictive.
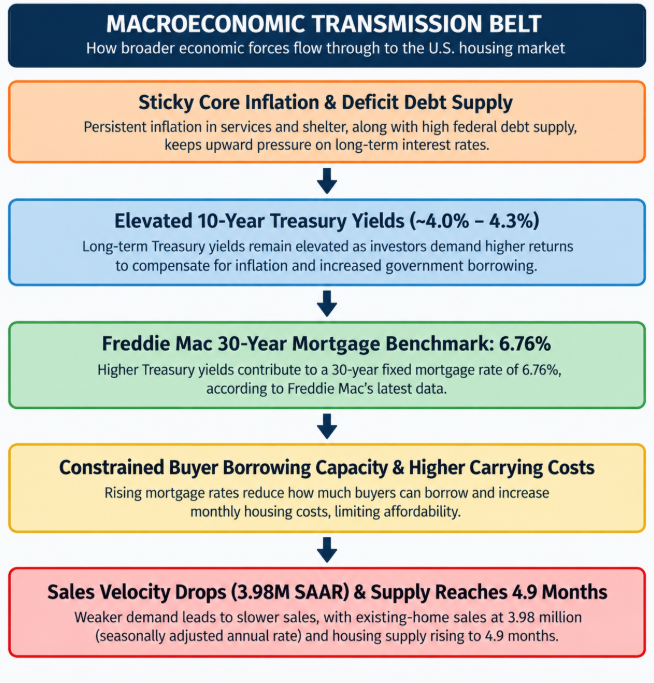
Employment conditions reflect balanced, moderate growth rather than overheating. NAR Chief Economist Lawrence Yun highlighted that while elevated borrowing costs caused a mild contraction in home purchases, cumulative sales for the first eight months of 2026 remain 1.6% ahead of the same timeframe in 2025, supported by 3.1% wage growth and 643,000 net new payroll additions.
Consumers are not in outright distress, but purchasing power is strained. At an average rate of 6.76%, the principal and interest payment on a median-priced home purchase demands substantially higher household income than historical norms. Consequently, buyers who remain active in September 2026 are underwriting their purchases with caution, requiring sellers to shoulder repair bills, rate buydowns, and closing fees.
National Housing Metrics: Pricing Disconnect and Regional Divergence
National aggregate figures conceal substantial regional divergence. While the national median existing-home sales price rose 1.6% year-over-year in August 2026 to $429,100—a record for the month—median pricing actually retreated from July's peak of $436,400.
The market shows clear bifurcation between product tiers and geography:
-
Price Tier Segmentation: Transactions for properties priced between $100,000 and $250,000 plummeted 10% year-over-year in August, crushed by rate sensitivity and lack of entry-level inventory.
-
Sun Belt & Mountain West Inventory Realignment: Metros across Texas, Florida, Arizona, and Colorado continue to experience inventory accumulation. Redfin's listing analytics highlight that substantial inventory surges in metros like San Jose (+25.5% YoY new listings), Seattle, and Nashville are driving price corrections on listings that overshot baseline fundamentals.
-
Midwest & Northeast Resiliency: Conversely, housing data tracked across Illinois, Connecticut, Indiana, and New Jersey demonstrates sustained price support.
The following comparison details key metrics defining the current market compared to recent benchmarks.
| Housing Metric | Current Period (August/Sept 2026) | Prior Period (July 2026 / Week Prior) | Year-Over-Year Comparison | Operational Meaning for Real Estate Operators |
|---|---|---|---|---|
|
30-Year Fixed Mortgage Rate |
6.76% Week of Sept. 10, 2026 |
6.71% Week of Sept. 3, 2026 |
+41 bps 6.35% Sept. 2025 |
High borrowing costs prevent sudden demand surges; necessitates creative financing structures. |
|
Existing-Home Sales Pace |
3.98M SAAR August 2026 |
4.06M SAAR July 2026 |
-1.2% YoY 4.03M August 2025 |
Sales volume is subdued; retail transaction velocity requires competitive pricing and marketing. |
|
Unsold Active Inventory |
1.62M units August 2026 |
1.57M units July 2026 |
+5.9% YoY 1.53M August 2025 |
Total active choices are accumulating, giving buyers choice and eroding seller listing monopolies. |
|
Months of Supply |
4.9 months August 2026 |
4.6 months July 2026 |
+0.3 months YoY 4.6 months Aug. 2025 |
Supply is approaching the 5.0–6.0 month equilibrium benchmark, weakening seller leverage. |
|
Median Existing-Home Price |
$429,100 August 2026 |
$436,400 July 2026 |
+1.6% YoY $422,400 Aug. 2025 |
Modest annual gains mask monthly softening; entry-level affordability remains strained. |
|
Median Days on Market |
31 days August 2026 |
29 days July 2026 |
Flat YoY 31 days Aug. 2025 |
Properties require a full month to clear on average; listings crossing 45 days face heavy discount pressure. |
|
Share Sold Below Asking |
59.5% August 2026 |
~57.8% July 2026 |
Elevated across non-supply-constrained markets |
More homes are selling below asking price, strengthening buyer negotiating power in many markets. |
Data Sources: Compiled from official releases by the National Association of REALTORS® August 2026 Housing Report , Freddie Mac Primary Mortgage Market Survey , and Redfin Housing Supply Market Analytics .
What This Means for U.S. Real Estate Investors
The current market provides opportunities for disciplined operators while penalizing passive, speculation-based investing. Understanding who benefits, who is exposed, and what actions each group must take is vital for navigating the remainder of 2026.
What is Happening?
Active housing inventory has reached 1.62 million units, while months of supply has reached 4.9 months.
Why is it Happening?
The primary engine driving this environment is the structural gap between mortgage borrowing costs and listing prices. Although home sellers have steadily added new listings to the market—bringing active inventory up 3.9% month-over-month—household wage growth of 3.1% is insufficient to absorb properties at 2023–2024 pricing multiples under 6.75%+ financing.
Why Does It Matter Now?
We have entered September, the beginning of the autumn seasonal cooling window. Historically, buyer foot traffic declines between Labor Day and Thanksgiving. In a market where inventory is already rising at the fastest pace in years, sellers who do not secure a contract by early October risk carrying their properties through the winter months. Carrying costs—including insurance premiums, property taxes, and loan interest—are higher than in previous cycles, forcing motivated sellers to negotiate aggressively on price and concessions.
Who Benefits?
-
Cash-Rich Investors and Balance-Sheet Buyers: With 27% of all transactions closing in cash, operators unencumbered by 7% mortgage debt can negotiate discounts against sellers who need closing certainty.
-
Creative Finance Dealmakers: Subject-to existing financing, seller-carry second mortgages, and hybrid wrap structures gain traction when retail financing remains expensive.
-
Turnkey Rental Acquirers in Stable Cash-Flow Metros: Investors targeting cash-flowing Midwest and Rust Belt markets, where inventory is tighter and rent-to-price ratios remain balanced.
Who Faces Greater Risk?
-
Over-Leveraged Flippers (Fix-and-Flip): Operators who budgeted a 90-day turnaround under optimistic resale valuations face margin erosion as properties average over 30 days on market and sell below list price.
-
Wholesalers Utilizing Generic Direct Mail: Wholesalers pitching thin 5% discounts will struggle to assign contracts to retail landlords who cannot make debt-service-coverage ratios (DSCR) pencil under standard conventional terms.
-
Sellers Anchored to Historic Peak Valuations: Homeowners attempting to test peak prices without offering repair credits or interest rate buydowns will see their listings linger into price-reduction territory.
Action Plan by Investor Persona
| 2026 Investor Strategy Playbook | |
|---|---|
|
Wholesalers |
Shift focus to problem-property scoring (tax liens, tired landlords, failed listings) and pre-vetted DSCR buyer requirements. |
|
Fix & Flip |
Underwrite holding periods at 180 days minimum. Budget 3%–5% for buyer concession credits upon resale. |
|
Buy & Hold (BRRRR) |
Eliminate optimistic refinance assumptions. Model exit debt at 7.25%–7.75% DSCR rates; require day-one yield. |
|
Real Estate Agents |
Guide sellers away from aspirational pricing; market temporary 2-1 buydowns instead of price drops. |
Wholesalers
The simple formula of pulling high-equity lists and offering 70% of estimated ARV minus repairs is no longer sufficient. In September 2026, buyers hold leverage, and end-buyers (landlords and flippers) require wider safety margins.
-
Target Problem Friction, Not Just Equity: Screen for properties with over 45 days on market, expired listings from late summer, inherited estates with multiple out-of-state heirs, or code enforcement violations.
-
Underwrite for Reality: When contracting a deal to assign to a landlord, confirm that the subject property delivers a minimum 1.20 DSCR under prevailing 7.25%–7.75% investor loan products. If the numbers require a 5.0% interest rate to cash flow, your end-buyer will walk away from their assignment deposit.
Fix-and-Flip Operators
Margins in fix-and-flip investing are dictated at the point of acquisition, not the point of sale.
-
Recalibrate Carrying Timelines: Model projects for a 6-month holding cycle (90 days renovation, 45 days marketing, 45 days closing) rather than pre-2022 90-day turnarounds. Holding debt at 10%–12% hard money costs will erode profits if a property sits for 50 days on the market.
-
Offer Concession Packages: When listing finished projects, market them with built-in seller concessions (e.g., offering a permanent 1-point rate buydown or a temporary 2-1 buydown) rather than simply slashing the list price. A $10,000 builder/flipper credit toward a buyer's interest rate reduces their monthly mortgage payment more effectively than a $10,000 price drop, expanding your prospective buyer pool.
Rental Property and BRRRR Investors
The Buy, Rehab, Rent, Refinance, Repeat (BRRRR) framework faces friction during the refinance phase due to higher exit cap rates and borrowing costs.
-
Stress-Test the Cash-Out Refinance: Never enter a project assuming you can pull 100% of your invested capital out upon completion. Appraisers are leaning conservative in markets with growing inventory. Model the refinance at a 70% loan-to-value (LTV) ratio at 7.5% interest. If the asset cannot cover its debt obligations and capital reserve allocations under those terms, execute as a standard long-term rental or look for alternative financing.
-
Analyze Property Insurance and Tax Resets: With property insurance adjustments taking place across Gulf Coast, Sun Belt, and Western wildfire zones, always obtain a binding insurance quote during your feasibility study. A $1,200 annual jump in hazard insurance will erase $100 per month of net operating income (NOI), undermining your cash flow.
Detailed Case Study: Acquisition and Underwriting in a 6.76% Rate Market
To evaluate how market conditions impact capital allocation, consider a realistic acquisition scenario for a single-family residential property (3 bedrooms, 2 bathrooms, 1,450 square feet) located in a suburban submarket experiencing inventory growth.
Scenario Parameters
-
Target Property: Distressed single-family rental, 1980s build, deferred cosmetic maintenance.
-
Original List Price: $265,000 (Listed 52 days; two price cuts from $285,000).
-
Negotiated Purchase Price: $225,000 (Investor cash-close or non-contingent conventional loan).
-
Seller Concession: $7,500 credit toward buyer closing costs and lender origination fees.
-
Renovation Budget: $30,000 (Kitchen refresh, interior/exterior paint, LVP flooring, mechanical tune-up).
-
Total Basis (Acquisition + Rehab + Net Closing Costs): $225,000 + $30,000 + ($8,500 - $7,500 credit) = $256,000.
-
Stabilized Market Value (Post-Rehab ARV): $295,000.
-
Stabilized Monthly Market Rent: $2,150.
Financing Structure (Long-Term DSCR Loan)
-
Loan-to-Value (LTV): 75% of Purchase Price ($168,750 loan amount).
-
Investor Interest Rate: 7.25% (reflecting typical ~50 bps spread over Freddie Mac's 6.76% benchmark for non-owner-occupied investment loans).
-
Amortization: 30 Years Fixed.
-
Monthly Principal & Interest (P&I): $1,150.84.
Operating Expense Projections (Monthly)
-
Property Taxes: $260.00
-
Hazard & Landlord Insurance: $145.00
-
Property Management Fee (8% of gross rent): $172.00
-
Vacancy Allowance (5% underwriting reserve): $107.50
-
Repairs & Maintenance Reserve (5%): $107.50
-
Capital Expenditures Reserve (CapEx, 5%): $107.50
-
Total Monthly Operating Expenses (Excluding Debt): $899.50
Financial Performance Metrics
Total Monthly Outflow = Debt Service ($1,150.84) + Operating Expenses ($899.50) = $2,050.34
Net Monthly Cash Flow = Gross Rent ($2,150.00) − Total Outflow ($2,050.34) = +$99.66/month ($1,195.92/year)
Initial Equity Injected = Down Payment ($56,250) + Rehab ($30,000) + Net Closing ($1,000) = $87,250
Cash-on-Cash Return = $1,195.92 $87,250 = 1.37% (Stabilized Day-One Yield)
Immediate Equity Captured = ARV ($295,000) − Total Basis ($256,000) = $39,000
Debt Service Coverage Ratio (DSCR) = Net Operating Income Before Debt Annual Debt Service
= ($2,150 − $899.50) × 12 $1,150.84 × 12 = $15,006 $13,810 = 1.09
Underwriting Assessment
At a 1.09 DSCR, standard institutional DSCR lenders requiring a minimum 1.20 to 1.25 coverage ratio will decline this financing structure unless the investor increases their equity contribution.
If this investor bought at the original $265,000 list price without a seller concession, this property would operate at a negative monthly cash flow of over $180 per month.
The Strategic Adjustment:
Rather than accepting a 1.09 DSCR, the disciplined investor uses their leverage in this 4.9-month supply environment:
-
Negotiate an additional $15,000 price adjustment down to $210,000, or
-
Require the seller to provide a $12,000 permanent interest rate buydown credit, lowering the investor's note rate from 7.25% to 6.25%.
At a 6.25% note rate, monthly principal and interest drops to $1,039.10, expanding monthly cash flow to $211.40 and raising the DSCR to 1.17.
The lesson is clear: In the current market, transactions are created during negotiations, not discovered on listing portals.
Strategic Playbook: Beginner vs. Experienced Investors
Recommendations for Beginner Investors
-
Avoid Speculating on Rate Cuts: Do not purchase marginal properties hoping that the Federal Reserve will lower rates and create an easy refinance opportunity. Underwrite every property to stand on its own based on current rents, verified tax assessments, real insurance costs, and prevailing interest rates.
-
Define a Strict "Buy Box": Beginners often make the mistake of evaluating single-family houses, small multifamily buildings, short-term rentals, and mobile home parks across five distinct counties simultaneously. In a market where inventory is expanding, pick one geographic market, one property profile (e.g., 3-bedroom, 2-bathroom single-family homes built after 1978), and one core strategy (long-term tenant placement).
-
Verify Hidden Ownership Costs: Insurance premiums and municipal property tax re-assessments have increased. Contact a local independent insurance agent and look up the municipal millage rate before submitting offers. Never use the seller's historical tax figure on a property that will be re-assessed at a higher purchase price.
Advanced Strategies for Experienced Operators
-
Deploy "Problem-Scoring" Lead Generation: Rather than mass-blasting generic postcards, build filtered lists that prioritize properties with compounding layers of friction:
$$\text{Target Lead Score} = (\text{Days on Market } > 45) + (\text{Price Reduction Count } \ge 2) + (\text{Out-of-State Owner}) + (\text{Older Roof/Deferred Mechanicals})$$ -
Structure Multi-Option Offers (The "Offer Menu"): In a market where 59.5% of listings sell below original asking, sellers often reject a single low cash offer out of hand.
-
Option A (Fast Cash Close): Lowest purchase price ($200,000), 10-day inspection, 14-day close, zero seller repairs, completely as-is.
-
Option B (Market Price with Seller Concessions): Moderately discounted price ($230,000), contingent on standard inspection and financing, with a 4% seller-paid rate buydown and closing credit.
-
Option C (Seller Financing / Hybrid Terms): Full asking price ($265,000), structured with 15% down payment, 4.5% interest-only or 30-year amortized payments to the seller, with a 5-to-7 year balloon. This provides the seller with their headline valuation and monthly installment income while providing the investor with manageable debt service.
-
-
Exploit Builder Inventory Competition: In regional submarkets with elevated housing completions (notably parts of the South and West), national homebuilders are offering 4.99% permanent rate buydowns and finish upgrades on new construction inventory.
Conclusion & Next Steps
The United States housing market in September 2026 is moving out of the gridlock that characterized the immediate post-pandemic rate-shock era. As active inventory expands to 1.62 million homes and supply reaches 4.9 months, buyers and investors are regaining the ability to negotiate price, terms, and concessions.
At the same time, with mortgage rates maintaining an average of 6.76%, capital discipline remains paramount.
To position your real estate investing business for the months ahead:
-
Audit Your Underwriting Models: Update your debt assumptions to reflect current rates, incorporate realistic days-on-market holding reserves, and verify local operating costs.
-
Re-engage Stale Listings: Build a dynamic pipeline of local properties that have crossed 30 to 45 days on market without going under contract.
-
Master Concession Structuring: Learn how to use interest rate buydowns and seller credits to build workable transactions without relying on extreme price cuts alone.