How to Find Motivated Sellers in a 3.8-Month Supply Market
Sep 10, 2026
Written by Discount Property Investor Team
The late-summer 2026 housing dynamic has broken away from the inventory freeze and rapid bidding wars that defined previous pandemic-era cycles. Finding off-market acquisitions and discounted real estate contracts no longer requires fighting through twenty unconditional offers on every listed property. According to the Redfin Housing Market Update, active inventory across the United States expanded to 1,504,085 homes, driving overall supply to 3.8 months while pending sales dropped 3.1% year-over-year to 307,830.
At the same time, new listings climbed 6% year-over-year to 376,235, marking the highest volume of new property inventory hitting the market since April. Homes are sitting on the market longer, carrying costs are accumulating for retail sellers, and listing concessions are returning. Roughly 20.8% of all active residential listings now feature an explicit price reduction.
When unsold housing inventory moves toward the 4-to-6-month benchmark of a balanced market, the psychological balance of power flips. Retail buyers retreat because benchmark 30-year fixed mortgage rates continue to linger in the 6.65% to 6.75% range, leaving equity-trapped, timeline-pressured, and fatigued property owners with fewer exit options. Capitalizing on this transition requires disciplined lead-sourcing systems that locate distress triggers before a property reaches an open auction or an expired status.
National Market Snapshot (Late Summer 2026)
| Housing Metric | 2026 Indicator Level | Annual Direction (YoY) | Investor Strategic Significance |
|---|---|---|---|
|
Active Available Inventory |
1,504,085 residential units |
+1.6% YoY |
Buyers possess negotiation runway; backup deals exist. |
|
Unsold Inventory Supply |
3.8 Months |
Up from 3.7 Months |
Approaching balanced market equilibrium (4.0 to 5.0 months). |
|
New MLS Listings |
376,235 units |
+6.0% YoY |
Surge in listing volume creates inventory clutter and fatigue. |
|
Pending Contract Closings |
307,830 contracts |
-3.1% YoY |
Contraction signals retail buyer hesitancy and cancellation spikes. |
|
Active List Price Cuts |
20.8% of available stock |
Elevated nationwide |
Direct filter signal for targeting sellers primed for concessions. |
|
Monthly Foreclosure Filings |
39,906 nationwide |
+10.0% YoY |
Upstream pipeline of pre-foreclosures and short sales grows. |
|
New Home Supply Backlog |
9.6 Months |
Severely Elevated |
Builder rate buydowns suppress retail demand for entry-level resales. |
Months of Supply vs. Pending Sales Trajectory
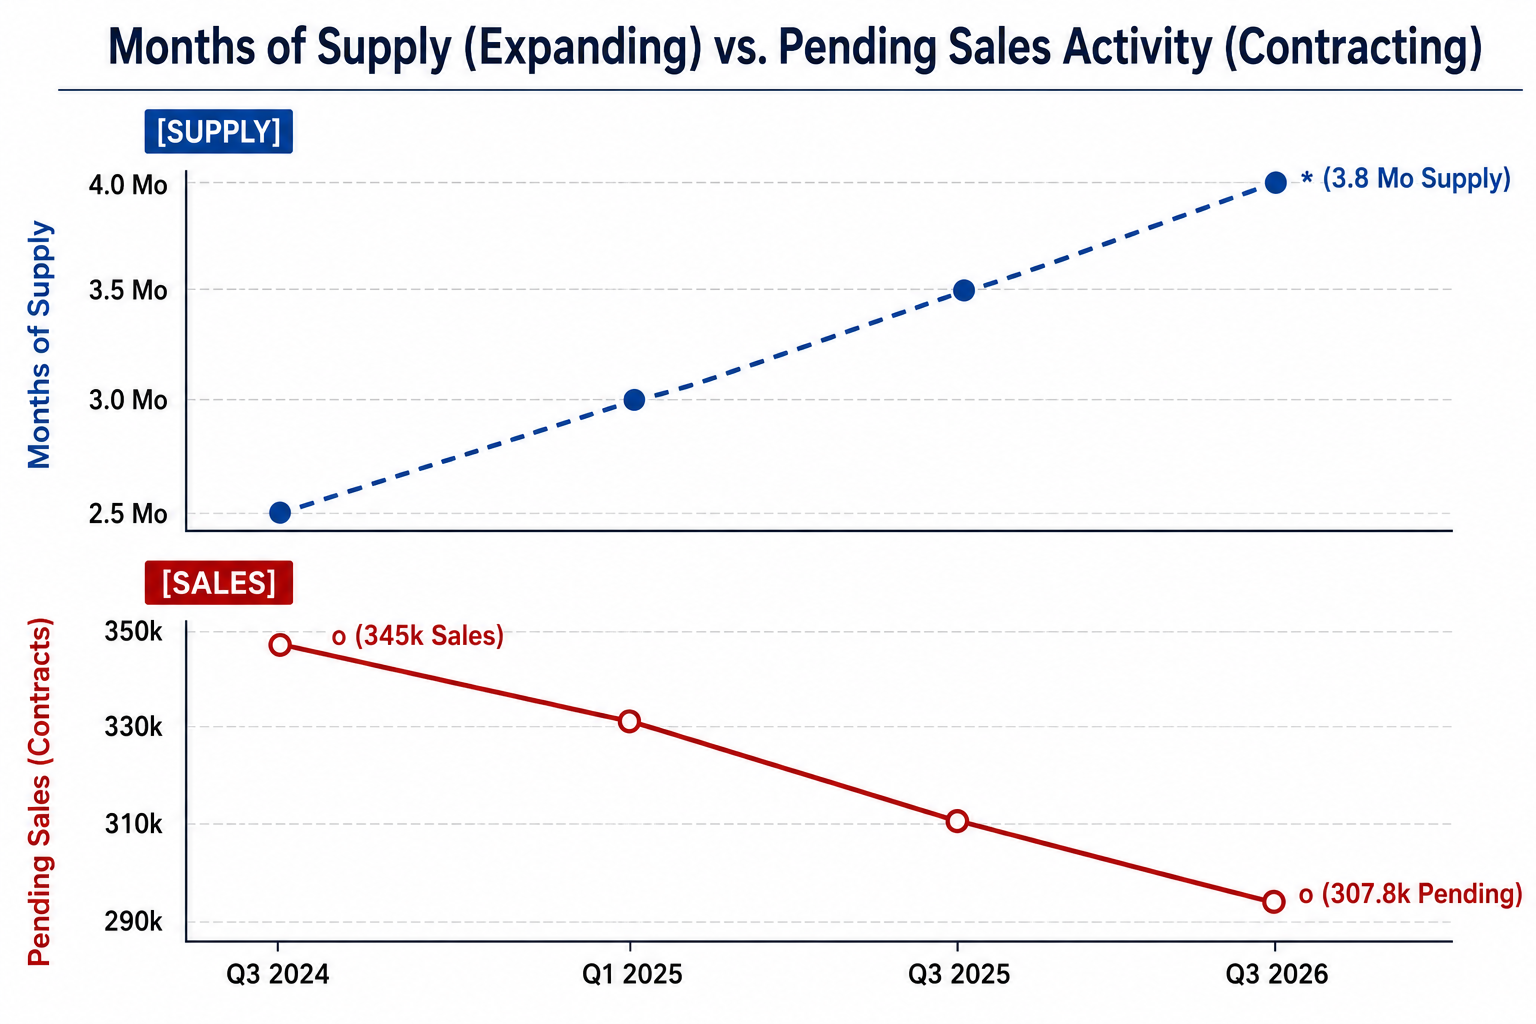
This divergence reveals an expanding spread between listing completions and executed sales contracts. As properties sit past the national median of 44 days on market, the probability of an unconditional retail sale declines, opening up acquisition windows for creative investors and cash buyers.
Strategy 1: Target the 20.8%—Price-Cut Arbitrage
When more than one in five listings cuts price, broad MLS filtering becomes a frontline sourcing engine. Slicing an asking price indicates an owner whose expectations have collided with market reality.
The Beginner Baseline
Set your local Multiple Listing Service (MLS) or database scrapers to isolate properties exhibiting three traits:
-
Days on Market (DOM) exceeding 45 days.
-
At least one formal recorded price drop of 5% or greater.
-
Original list price positioned above the median sales price for that zip code.
A seller who cuts their price once has conceded that their initial thesis was flawed. Because contract volumes have slipped 3.1% year-over-year, these owners face dwindling showing volumes and high anxiety ahead of seasonal winter slowdowns.
The Seasoned Investor Upgrade: Equity-to-Reduction Ratio
An unanchored price cut is meaningless if the owner has zero equity. Pull municipal deed records and cross-examine the current mortgage balance against the original recording date.
If the seller purchased between 2012 and early 2022, their underlying cost of capital is likely fixed between 2.75% and 3.75%. Even after a $30,000 reduction, their primary loan balance may sit at 40% to 60% of current real market value.
This seller does not require a bailout—they require capital redeployment or debt relief. Pitch an all-cash offer with a guaranteed 10-day close, or present a hybrid terms structure (e.g., executing an installment sale or purchasing subject-to the existing low-interest financing while paying out their accrued equity in cash).
Days on Market Post-Price Cut
Track DOM after the reduction, not just gross DOM. A home that sat for 40 days, cut its price $25,000, and has now sat for an additional 21 days with no contract is far more distressed than a fresh listing that dropped price 48 hours ago. When post-cut DOM passes the three-week mark, pitch aggressive cash terms without appraisal contingencies.
Strategy 2: Pre-Foreclosure Starts and Default Heat-Mapping
Tracking published bank auctions leaves you bidding against established institutional capital on courthouse steps. True margin lives upstream during initial default proceedings.
Based on default recording data published in the ATTOM U.S. Foreclosure Market Report, lenders filed 39,906 total foreclosure notices in July 2026—a 10% year-over-year increase. More importantly, early-stage foreclosure starts rose to 26,648 properties nationwide.
The Beginner Baseline
Subscribe to county court lis pendens or Notice of Default (NOD) daily registers. Early foreclosure notices give owners 90 to 120 days before a scheduled auction. Reaching a borrower during the first 30 days of this window lets you solve their problem before thousands of dollars in lender legal fees and default interest penalties eat away their remaining equity.
The Seasoned Investor Upgrade: Zip-Code Concentration
Foreclosure volume is never distributed evenly across a region:
-
Top State Volumes: Texas led foreclosure starts with 3,306 filings, followed closely by Florida with 3,277 and California with 2,540.
-
Highest Per-Capita Exposure: Nevada recorded the highest overall rate (one in every 1,703 housing units), followed by South Carolina (one in 2,085) and Florida (one in 2,232).
-
High-Yield Micro-Metros: On a metropolitan level, Punta Gorda, Florida posted the nation’s highest default concentration at one filing per 899 homes, with markets like Killeen, Texas and Las Vegas, Nevada following close behind.
Instead of mailing across an entire county, concentrate marketing dollars on the top 10% of zip codes with the highest density of default filings.
Climate and Insurance Stress Multipliers
In hurricane corridors along the Atlantic basin and the Gulf of Mexico, storm exposure intersects with rising insurance premiums. Owners facing elevated property-insurance renewals alongside standard deferred maintenance often look to liquidate quickly. Layering weather alerts and property damage indices over active pre-foreclosure lists pinpoints owners facing unmanageable restoration costs.
Strategy 3: New-Construction Absorption Discrepancies
The single-family housing inventory story is split between two entirely different markets: aging existing homes and an oversupplied new-construction sector.
Data highlighted in the Realtor.com Monthly Housing Trends notes that newly built residential inventory carries 9.6 months of unsold supply nationally—more than double the supply of existing residential homes.
Large production homebuilders are slashing margins, offering 4.99% permanent rate buydowns, and paying buyer closing costs to clear inventory before fiscal year-ends. This dynamic impacts surrounding existing home inventory in two clear ways:
-
Direct Spec Acquisition: Regional builders cannot afford to carry completed inventory into the winter months. Run queries on speculative homes that have sat completed for over 90 days. Negotiate package deals on multiple properties, demanding price discounts or substantial builder-paid financing buydowns.
-
The 2024 Resale Trap: The cleaner off-market play focuses on small private investors who bought newly built properties in master-planned communities throughout 2024 and 2025. These buyers often planned to flip or lease the property at high cap rates. However, with national appreciation slowing to modest 1.5% to 1.9% annual bands and local rents softening, they face competition from the original builder, who is offering generous buyer incentives right down the street.
Examine county transfer sheets for non-owner-occupied entities (LLCs, trusts, out-of-state entities) that acquired spec builds within the last 18 to 24 months. Match those deeds against properties listed on the MLS past 60 days. These landlords are often trapped in negative monthly cash flows at current interest rates and are receptive to discount cash offers or debt assumptions.
Strategy 4: The Stale Listing Combined with Life Transitions
An unsold property is a symptom; life transitions are the root cause of deal flow. When an asset languishes on the market for two to three months while a major life event unfolds, the owner transitions from a hopeful retail seller into an urgent seller.
The Beginner Baseline
Filter public property databases for listings older than 60 days that show clear physical or logistical red flags:
-
Property tax mailing addresses located in a different state.
-
Shut-off utilities or documented code compliance notices.
-
Public probate filings or estate execution paperwork.
A long-distance heir or an out-of-state owner has little appetite for spending their weekends coordinating plumbing contractors, landscaping crews, and open houses.
The Seasoned Investor Upgrade: Public Records Stacking
Combine public MLS feeds with county civil dockets to build a multi-layered motivation filter:
-
Probate and Inheritance: Cross-reference newly recorded estates with local MLS listings. When multiple siblings inherit an older home that fails modern FHA/VA appraisal inspections, a single cash buyer who waives repair contingencies solves a major family point of friction.
-
Domestic and Civil Disputes: Search county civil court dockets for divorce decrees that mandate property liquidations. When both parties are legally required to divide real property assets to finalize a decree, market-clearing speed supersedes top-dollar negotiations.
-
Corporate Relocations: Check professional social platforms and regional corporate moves for executives transitioning to different metropolitan markets. If an executive takes a new role elsewhere while their primary home sits on the market for 75+ days, carrying two mortgages quickly triggers an appetite for a swift off-market resolution.
Strategy 5: Landlords Squeezed by Softening Rents and High Rates
The small-scale landlord sector (1 to 4 units) faces an operational squeeze. Data outlined in the Kiavi Real Estate Investor Report shows how shifting financial margins continue to compress bottom-line cash flow for levered single-family rental operators. Concurrently, broader residential rental statistics tracked in the Apartment List National Rent Report peg the national median rent at $1,388, reflecting a steady 1.1% year-over-year contraction.
In Sun Belt hubs that experienced massive multifamily and build-to-rent delivery cycles, market rents have dropped faster than operating expenses. Landlords who purchased between late 2023 and 2025 using short-term floating debt or high-rate DSCR products are often seeing zero or negative net margins.
Sourcing Squeezed Landlords
Search rental platforms, local FSBO classifieds, and MLS expireds for 1-to-4 unit rental properties:
-
Filter for properties that have sat unrented for more than 45 days.
-
Target properties owned by individuals rather than private equity conglomerates. Institutional firms have deep reserves, but private investors feel debt-service deficits directly out of their personal bank accounts each month.
The Reality Underwriting Conversation
When engaging these owners, present a detailed, data-backed operational pro forma:
-
Show their property’s actual, local market-clearing rent based on recent signed leases, not outdated peak figures.
-
Deduct realistic allowances for ongoing vacancy (5% to 8%), property management fees (8% to 10%), and reserves for capital expenditures.
-
Factor in their current debt-service payments.
When an owner sees an objective breakdown confirming they are subsidizing the asset by $400 every single month—with values appreciating at just 1.5%—the discussion moves naturally from defending a vanity price to negotiating an exit strategy. Offer to buy out their position, relieve them of tenant management, or structure an installment sale that trades active property maintenance headaches for predictable monthly note payments.
Lead Scoring Distribution and Conversion Rates
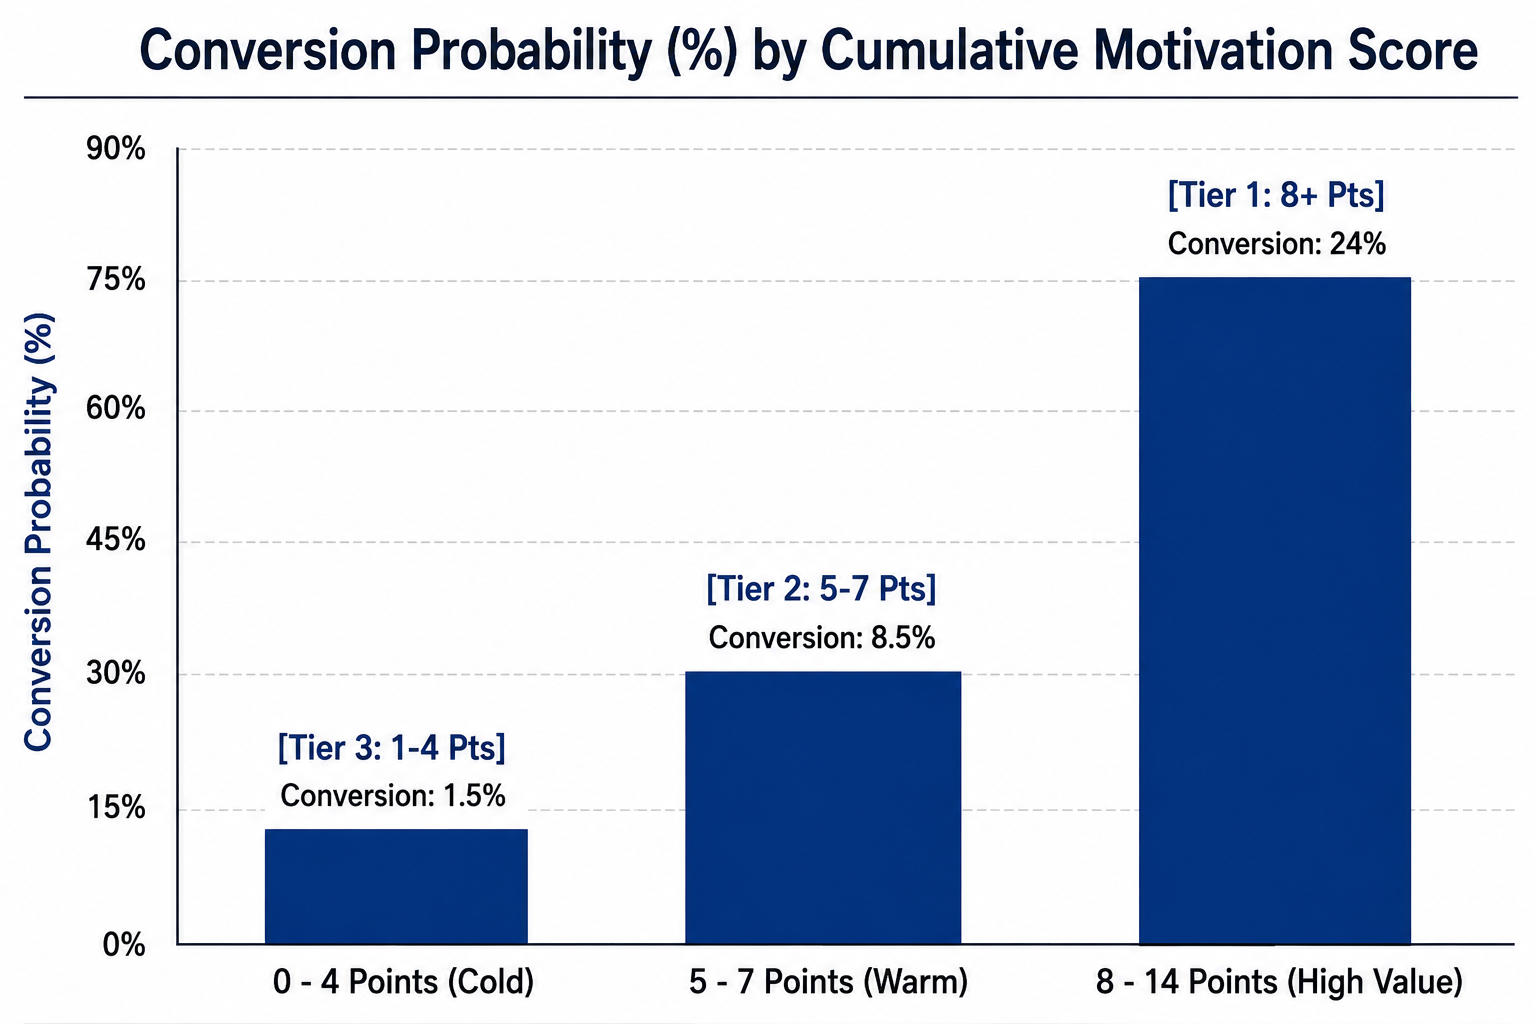
Directing marketing dollars across thousands of generic records yields diminishing returns. Weighting leads by cumulative distress indicators lets you focus resources on prospects with the highest probability of closing.
Deep Dive: Constructing the Lead Scoring Engine
To scale your acquisition process beyond ad-hoc MLS queries, implement a formal mathematical scoring rubric. Every record that enters your Customer Relationship Management (CRM) platform should receive an automated composite score from 0 to 14 points based on verified public records and listing data:
-
Active MLS Listing Exceeding 60 Days on Market (+2 Points): Reflects market rejection at current pricing, seller fatigue, and recurring mortgage holding costs.
-
Price Reduction Recorded in the Prior 30 Days (+2 Points): Confirms the seller has broken psychological anchoring and acknowledges shifting buyer demand.
-
Absentee or Out-of-State Primary Tax Address (+1 Point): Signals logistical friction, reliance on third-party property managers, and detachment from local trends.
-
Verified Property Vacancy (+2 Points): Confirms the asset is generating zero revenue while accruing utility costs, property tax liabilities, and physical deterioration risks.
-
Active Lis Pendens or Foreclosure Notice Recorded (+3 Points): Indicates a strict legal timeline with lender-enforced deadlines that compel action.
-
Documented Life Transition / Distress Signal (+3 Points): Identifies external drivers (probate court filings, divorce petitions, corporate transfers) that necessitate property liquidation.
-
Direct Inbound Inquiry from Tired Landlord Lead Channel (+1 Point): Demonstrates self-identified operational exhaustion from managing tenants, maintenance calls, or non-paying occupants.
Pipeline Allocation Rules
-
Tier 1 (Score 8 to 14): High Priority. Allocate 70% of outbound direct calling, customized skip tracing, and door knocking to this group.
-
Tier 2 (Score 5 to 7): Pipeline Nurture. Direct into automated bi-weekly SMS check-ins and monthly sequence mailings.
-
Tier 3 (Score 0 to 4): Passive Tracking. Retain inside your database with periodic market reports, minimizing manual labor expenditures.
Conversion Frameworks: Speed-to-Contact and Follow-Up Workflows
Sourcing motivated sellers accounts for only half of the acquisition equation; your follow-up cadence determines whether those conversations turn into signed purchase contracts.
In a normalizing market, response speed makes a decisive difference. Research published by TeleVista Lead Generation reveals that responding to an inbound seller inquiry within five minutes makes that lead 21 times more likely to convert into a qualified sales opportunity compared to waiting 30 minutes.
The Omnichannel 7-Day Contact Sequence
When a high-scoring lead enters your CRM, launch this structured, multi-channel outreach schedule:
-
Day 0 (Within 5 Minutes): Immediate outbound phone call. If unanswered, leave a professional voicemail and follow up with a concise text message confirming your ability to buy the home for cash on a flexible schedule.
-
Day 1 (+24 Hours): Deliver a professional email containing verified proof of funds, a brief company profile, and case studies of two to three recently closed local transactions.
-
Day 3 (+72 Hours): Execute a second phone call and text message focusing on their preferred timeline and any specific terms they require.
-
Day 5 (+120 Hours): Dispatch a personalized, hand-addressed letter to the owner’s primary tax address.
-
Day 7 (+168 Hours): Conduct a final direct phone check-in before shifting the prospect into an automated long-term email and SMS drip campaign.
Deal pipeline analyses compiled by SwiftLeads AI show that over 80% of off-market acquisitions close between the fifth and twelfth customer touchpoint, whereas the majority of amateur investors cease communication after just two failed attempts.
Discovery Scripts: Extracting Seller Urgency
Directly asking a seller if they are desperate or willing to take a steep discount triggers defensive posturing. Experienced acquisition specialists ask diagnostic discovery questions that allow sellers to share their operational and personal challenges:
1. "If we come to terms on an agreement tomorrow, where are you headed next, and how quickly do you need to be there?"
This question redirects the seller's attention away from defending an arbitrary asking price and toward their forward-looking timeline. If they must relocate for employment or close on a replacement property within 30 days, their calendar dictates their decision-making. If they have no target destination, they are likely still testing the retail market.
2. "What has the feedback been from buyers and agents who have toured the property over the last month?"
This prompts the owner to verbalize the property’s physical and aesthetic flaws. As they recount complaints about aging mechanical systems, floor plan issues, or deferred maintenance, they internally justify why an as-is investor purchase discount is logical.
3. "If we take care of all clean-out requirements, cover standard closing costs, and waive appraisal contingencies, what net dollar figure do you need to walk away with?"
Focusing on net proceeds bypasses top-line gross listing prices and removes emotional attachment to fee deductions. It reframes the transaction around simplicity, certainty, and speed.
Market Dynamics: Late Summer 2026 vs. Past Cycles
Building a resilient acquisitions pipeline in today's housing market requires navigating three market realities:
-
Price Growth Has Moderated: Annual appreciation has dropped from historic double-digit highs to stable 1.5% to 1.9% annual bands. Sellers can no longer rely on runaway inflation to rescue an overpriced initial listing.
-
Inventory Is Rebalancing, Not Collapsing: Total active inventory sits near 1.5 million units. While up year-over-year, supply remains approximately 11% below typical 2017–2019 pre-pandemic baselines. This environment represents a return to seasonal normalcy rather than a systemic foreclosure crash, meaning investors must hunt for operational distress rather than relying on market-wide collapses.
-
The Hidden Cost of Waiting: Many sellers continue to hold out for prospective interest rate cuts. Quantify their exact monthly carrying costs—including property taxes, insurance, HOA dues, and loan interest. Demonstrating that holding an unsold property for an additional six months costs thousands of dollars helps sellers see the value in a clean, certainty-backed closing today.
Tactical Summary for Real Estate Investors
Generating off-market deal flow in a 3.8-month supply market requires a structured, proactive outreach approach:
-
Filter for listings on the market over 45 days that have recorded a price cut of 5% or more, prioritizing those sitting past 21 days post-reduction.
-
Monitor county lis pendens and Notice of Default filings early to help homeowners navigate pre-foreclosure before formal bank auctions take place.
-
Look for newly completed developments with over nine months of supply, identifying tired investors who bought at the market peak and now face builder competition.
-
Cross-reference listings past 60 days on market with probate, divorce, and corporate relocation records to find compounding motivation.
-
Target mom-and-pop landlords managing 1-to-4 unit rentals who are feeling the pinch of softening rents and elevated financing costs.
-
Score incoming leads systematically and maintain a disciplined follow-up schedule across phone, text, email, and mail through at least seven touchpoints.
Select one of these primary sourcing channels today and begin building your pipeline. By tracking emerging distress indicators and approaching sellers with practical, problem-solving offers, you can consistently secure profitable acquisitions in any market cycle.