Homes vs. Paychecks: The 20-Year Affordability Gap
Feb 15, 2026
Written by David Dodge
Over the last twenty years, housing affordability has shifted from a periodic concern to a defining structural issue in the U.S. economy. What was once framed as a problem limited to a handful of high-cost coastal cities has gradually become a widespread national pattern. In many communities, home prices have climbed far more quickly than the incomes of the people who live and work there. The gap between what homes cost and what households earn has widened steadily, reshaping how Americans think about ownership, mobility, and long-term financial security.
A recent analysis from the Federal Reserve Bank of St. Louis documents this divergence in detail. Expanding on those findings, this article explores why the gap emerged, how it is measured, and what it means for households across generations.
A Growing Divide Between Prices and Incomes
From 2000 to 2024, median per-capita income in the United States rose by roughly 155% in nominal terms, according to the St. Louis Fed’s research. Over the same period, median home prices increased by about 207% in nominal terms (see the detailed figures in the St. Louis Fed article linked above). Both numbers appear strong in isolation, yet the difference between them is what matters most. When home values outpace income growth by such a wide margin over two decades, affordability erodes structurally and persistently.
This divergence means buyers today must navigate a more demanding financial landscape than previous generations did. The pressure shows up in several ways:
-
Larger down payments relative to annual income
-
Higher mortgage payments compared to wage growth
-
Stricter debt-to-income thresholds for loan approval
-
Greater reliance on dual incomes or outside financial support
Over time, these hurdles delay entry into homeownership and shift the profile of who can realistically purchase a home.
Why Measurement Matters More Than It Seems
It is tempting to track affordability using median home prices alone. However, median sale prices can be misleading because they depend heavily on which homes are sold in a given year. If more high-end homes change hands, the median price rises even if the value of a typical home remains stable. Likewise, newly constructed homes are often larger and more expensive, which can push median prices higher simply because the mix of homes has changed.
To avoid these distortions, economists often use repeat-sales indexes. Instead of comparing different homes from one year to the next, repeat-sales methods follow the same property across multiple transactions. This approach isolates true appreciation by comparing a home to its own past sale. The St. Louis Fed relied on repeat-sales-style measures at the county level to produce a clearer picture of long-run price growth.
When measured this way, the pattern becomes unmistakable. In most counties with available data, home values rose substantially between 2000 and 2024. In many areas, prices more than doubled. The affordability challenge, therefore, is not simply the result of changing sales composition; it reflects genuine and widespread appreciation.
A Broad National Shift
The county-level analysis in the St. Louis Fed study spans 1,492 counties between December 2000 and December 2024 (see the county growth map in the original article). The data show price growth across much of the country. Strong appreciation occurred along the West Coast and in the Mountain West, while parts of Texas and Florida also experienced pronounced increases. Even areas traditionally considered affordable, including portions of the Midwest and Southeast, saw steady price gains.
The scale of growth varied by region, but the direction was consistent across regions. Home values generally moved upward over the long run. This suggests that affordability pressures are not limited to a few high-profile metropolitan areas. Instead, they reflect broader structural forces affecting housing markets nationwide.
The Economic Forces Behind the Divergence
At its core, the sustained rise in home prices relative to incomes can be explained by shifts in demand interacting with constrained supply. In many metropolitan areas, zoning regulations, land-use rules, and development limits have made it difficult to expand housing stock quickly. When demand increases against an inelastic supply curve, prices tend to rise rather than construction volumes.
Several forces contributed to the stronger demand over the past two decades. Mortgage rates declined significantly from 2000 through 2021, lowering borrowing costs and effectively increasing buyers’ purchasing power. Even if wages grew modestly, cheaper financing allowed households to bid more for homes. Credit conditions in the early 2000s further amplified demand, and in the years following the financial crisis, institutional investors increasingly viewed U.S. housing as an attractive asset class.
Counties with strong labor markets, good schools, and desirable amenities experienced particularly strong appreciation. These local characteristics were capitalized into land values, pushing prices higher in high-opportunity areas. At the same time, income growth was not evenly distributed. Higher-income households, benefiting from stronger gains, were better positioned to compete for the limited housing stock.
The House-Price-to-Income Ratio: A Clear Indicator
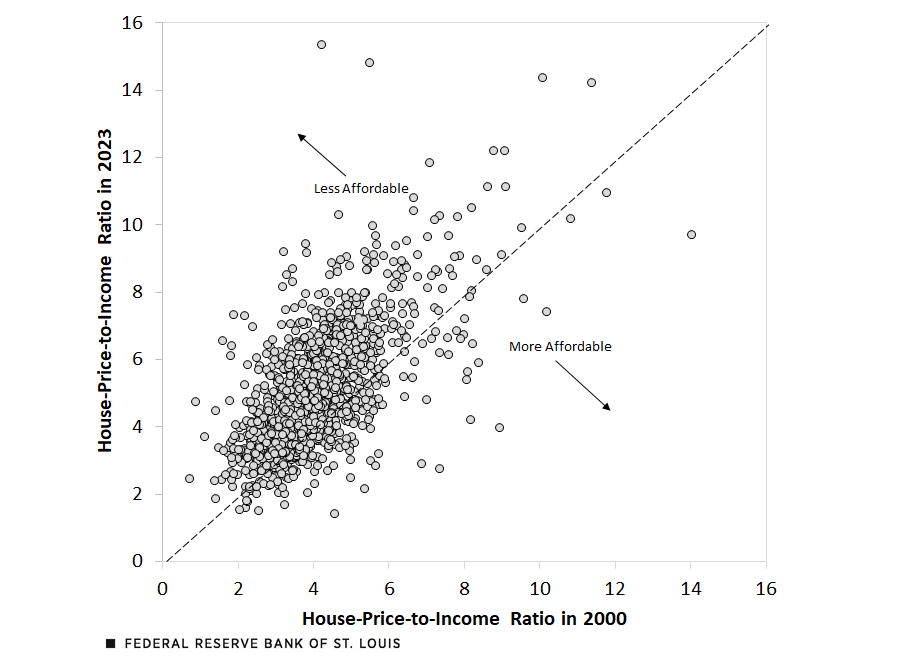
To make affordability changes concrete, economists compare home values to local incomes using the house-price-to-income ratio. When this ratio increases, housing becomes less affordable relative to earnings.
The St. Louis Fed’s county-level comparison of ratios in 2000 and 2023 shows that most counties lie above the 45-degree line in their scatterplot, indicating that affordability deteriorated over time (see the affordability comparison in the original article). Counties that were already expensive often became even more so relative to income, while many middle-cost counties moved into higher price multiples.
Only a relatively small number of counties experienced improvements. The overall pattern suggests that rising home prices have outpaced income growth in most places, not just in coastal markets.
Generational and Wealth Implications
The consequences of this long-run divergence extend beyond monthly mortgage payments. They influence life decisions, wealth accumulation, and economic mobility. Younger households often require more years to save for a down payment, leading to delayed first-time purchases. The average age of first-time buyers has increased, reflecting how much longer it now takes to meet financial thresholds.
Existing homeowners, on the other hand, have benefited from appreciation. As property values rose, housing became an increasingly central component of household wealth. The divergence between owners and renters widened because owners participated in asset growth while renters faced higher barriers to entry.
Over time, the affordability gap contributes to broader economic effects:
-
Slower geographic mobility as workers hesitate to relocate to high-cost areas
-
Increased financial fragility among households is making it difficult to afford housing
-
Greater wealth inequality between owners and non-owners
Housing thus functions not only as shelter but also as a mechanism that shapes the distribution of economic opportunity.
Monetary Policy and Long-Run Effects
Monetary policy has played an indirect but important role. Lower interest rates support employment and growth, yet they also tend to raise asset valuations. In markets where supply cannot expand quickly, falling rates can push home prices upward rather than significantly increasing construction.
This interaction complicates policy decisions. Efforts to stabilize the broader economy can intensify affordability challenges in housing, especially when supply-side constraints remain binding.
Final Thoughts: Why This Moment Demands Attention
The story of the past two decades is not simply about rising prices. It is about a structural imbalance between earnings and asset values that has gradually reshaped economic opportunity. When housing consistently outpaces income growth, the implications compound across generations. What begins as a pricing trend evolves into a barrier to mobility, a divider of wealth, and a filter that determines who participates in long-term financial gains.
If this trajectory continues unchecked, the traditional pathway to middle-class stability—steady employment leading to attainable homeownership—risks becoming less predictable and less inclusive. That outcome is not inevitable, but it does require acknowledging the scale of the challenge. Policies that address supply constraints, encourage responsible development, and support sustainable income growth will be central to restoring balance.
The evidence presented in the St. Louis Fed’s research makes one point unmistakably clear: in much of the United States, homes have decisively outrun paychecks. Recognizing this gap is the first step. The next is determining how to ensure that future decades do not repeat the same pattern.
Housing is more than a market statistic. It is where families build stability, where communities take shape, and where wealth is often first accumulated. Ensuring that it remains accessible to broad segments of society is not only an economic concern—it is a foundational issue for long-term prosperity.