Why Homes Sit Longer in Summer 2026: Great News for Buyers
Jul 29, 2026
Written by Discount Property Investor Team
The Mid-2026 Market Shift and the End of Panic Buying
If you have been monitoring the U.S. housing market over the first half of 2026, you have likely noticed a palpable shift in the daily atmosphere. The aggressive early-year rebound—fueled by optimistic buyers rushing into the market during temporary dips in borrowing costs—has steadily leveled off as we settle into the summer months. Across neighborhoods nationwide, the frantic, high-anxiety energy that defined the post-pandemic real estate arena is being replaced by something the market has desperately needed for over five years: operational breathing room.
For much of the past half-decade, buyers were conditioned to operate in a state of perpetual urgency. We lived through an era where listings vanished within 48 hours of hitting the Multiple Listing Service (MLS), sight-unseen offers were standard operating procedure, and buyers routinely waived essential contractual protections just to have their bids considered. But as we navigate through the summer of 2026, that hyper-competitive landscape is undergoing a profound structural transformation.
To understand why this is happening, we have to look at the macroeconomic foundation driving buyer behavior. Borrowing costs have established a persistent baseline that requires careful financial planning rather than impulsive bidding wars. According to weekly mortgage benchmark data,
When borrowing costs linger above 6.5%, the pool of qualified buyers naturally tightens, and those who remain in the arena become vastly more analytical about where they deploy their capital. The direct consequence of this rate environment is a noticeable slowdown in property velocity. Properties that would have sparked multi-offer bidding wars just two seasons ago are now greeting their third and fourth open houses without a pending sticker on the yard sign.
Unfortunately, mainstream financial media thrives on sensationalism. Turn on any cable business channel or scroll through headline aggregators, and you will inevitably encounter doom-and-gloom narratives warning of an impending real estate collapse. Commentators point to rising inventory numbers and lengthening marketing timelines as proof that the sky is falling. But as seasoned market practitioners, we know that headlines rarely reflect the operational reality on the ground.
At the Discount Property Investor Team, our philosophy has always been anchored in objective data rather than emotional market cycles. When you strip away the sensational headlines and examine the underlying metrics of the mid-2026 market, a completely different story emerges. What we are witnessing today is not the onset of a catastrophic housing crash, but rather a healthy, overdue stabilization.
The pendulum, which had swung so violently in favor of sellers that it broke the traditional rules of engagement, is finally swinging back toward equilibrium. Homes sitting longer on the market and price cuts returning to the MLS are not signs of economic decay; they are the hallmarks of a normalizing marketplace where supply and demand are finding a sustainable balance.
For prospective homebuyers and real estate investors who have been sitting on the sidelines waiting for the madness to subside, this summer represents one of the most compelling opportunity windows in recent memory. The pressure cooker has depressurized. In this comprehensive breakdown, we will examine exactly why properties are spending more time on the market this summer, explore the fascinating "de-listing" phenomenon reshaping inventory levels, and provide you with actionable, battle-tested strategies to leverage this market shift to secure major seller concessions and interest rate buydowns.
1. The Anatomy of a 52-Day Market: Why Property Velocity Has Slowed
To appreciate the magnitude of the mid-2026 market shift, we must examine the hard data governing listing velocity. For years, the median time a home spent on the market was artificially suppressed by inventory deficits and stimulus-driven demand. Today, those numbers are returning to historical reality.
Recent nationwide housing research confirms this stabilization, showing that
Let us put that 52-day median into historical perspective. During the peak frenzy of 2021 and early 2022, national median days on market plunged to an astonishing 14 to 18 days, with desirable suburban starter homes frequently going under contract in 72 hours or less. That pace was structurally unhealthy and unsustainable. However, if we look back at the 2017–2019 pre-pandemic housing market—a period universally recognized by economists as a healthy, balanced real estate environment—the national median time on market consistently hovered between 50 and 60 days.
What we are experiencing this summer is simply a return to historical norms. But why does a home sitting for 52 days feel so dramatic to today's market participants? The answer lies in the cumulative effect of daily inventory accumulation.
When property velocity slows from 15 days to 52 days, active inventory on the MLS builds up rapidly, even if the actual pace of new listings entering the market remains flat. Think of the housing market as a bathtub: if the faucet (new listings) runs at a steady rate, but the drain (homes going under contract) slows down by 70%, the water level (active inventory) inevitably rises. This dynamic has fundamentally altered the psychology of both buyers and sellers across the country.
The Return of Price Cuts as an Operational Reality
For the past several years, sellers entered the market with an anchor bias, pricing their homes based on the most aggressive comparable sales from six months prior and assuming the market would catch up to their number. In mid-2026, the market is no longer validating that overconfident pricing strategy.
When a property sits on the market for three weeks without generating a viable offer, the seller faces a critical decision point. As a result, downward price adjustments have returned to the daily real estate feed with a vengeance. Detailed spring and summer market reporting illustrates this correction clearly, where
Buyers need to understand the mechanics of these price drops. A price cut is rarely an indication that a property is physically defective or located in a deteriorating neighborhood. Instead, it represents the collision between outdated seller expectations and current mortgage mathematical reality. When borrowing costs sit at 6.58%, a buyer purchasing a $450,000 home faces a monthly principal and interest payment of roughly $2,300 (assuming a 20% down payment), excluding property taxes and insurance. At that monthly cost, buyers simply cannot afford to overpay for unrenovated kitchens, aging HVAC systems, or aspirational pricing.
When 16% to 20% of active listings across a major metropolitan area are forced to reduce their asking prices to attract traffic, the entire pricing equilibrium of the market resets. Sellers who need to transact due to job relocations, estate settlements, or growing families are realizing that they must meet the buyer where they are. This realization is the catalyst that transforms a stagnant listing feed into a landscape of opportunity for prepared buyers.
2. Data Graph: Mortgage Rates vs. Property Velocity (2021–Summer 2026)
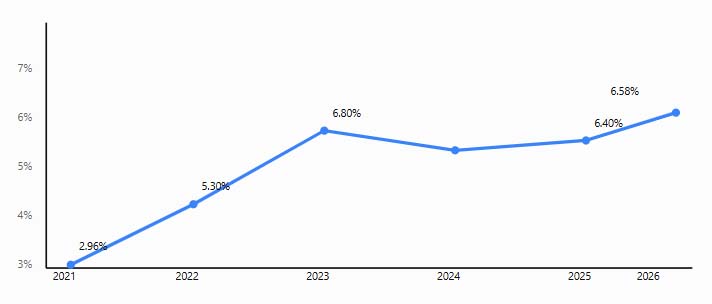
To visualize how borrowing costs directly dictate the pace of home sales and the frequency of seller price reductions, examine the historical correlation data compiled by our research team below. Notice how the steady climb in 30-year fixed mortgage rates corresponds with the expansion of marketing timelines and the normalization of price cuts.
U.S. Housing Market Velocity & Rate Trajectory (2021–Mid-2026)
| Metric | 2021 | 2022 | 2023 | 2024–2025 | Summer 2026 |
|---|---|---|---|---|---|
| DOM | 15 Days | 28 Days | 45 Days | 49 Days | 52–53 Days |
| Cut% | 4.2% | 9.8% | 14.5% | 16.0% | 17.2% |
| DOM: Median Days on Market | Cut%: Share of active MLS listings with price reductions | |||||
| Analytical Breakdown of the U.S. Housing Market Metrics | |||||
|---|---|---|---|---|---|
|
Market Epoch |
Avg. 30-Yr Fixed Rate |
Median DOM |
Listings with Price Cuts |
Market Characterization & Buyer Leverage |
|
|
2021 (Stimulus Peak) |
2.96% |
15 Days |
4.2% |
Extreme seller frenzy with severe inventory shortages. Bidding wars dominated most listings, and waived contingencies became common. |
|
|
2022 (The Pivot) |
5.30% |
28 Days |
9.8% |
Mortgage rates surged as the Federal Reserve tightened policy, slowing buyer demand and ending the rapid seller's market. |
|
|
2023 (Affordability Crunch) |
6.80% |
45 Days |
14.5% |
Transaction activity slowed as affordability declined. Buyers gained leverage and increasingly requested inspections and repairs. |
|
|
2024–2025 (Stabilization) |
6.40% |
49 Days |
16.0% |
Housing inventory steadily rebuilt, giving buyers more options and restoring traditional negotiations. |
|
|
Summer 2026 (The Norm) |
6.58% |
52–53 Days |
17.2% |
A balanced marketplace with normal selling timelines, frequent seller concessions, and increased opportunities for well-prepared buyers. |
|
Data Sources: Freddie Mac Primary Mortgage Market Survey, Realtor.com Monthly Housing Research Reports, and Discount Property Investor Market Analytics.
What does this data visual tell us as buyers and investors? It proves that property velocity is intimately bound to the cost of capital. When rates sat below 3%, money was essentially free, and time on market collapsed. Now that rates have stabilized in the mid-6% range, the market has expanded its timeline to 52–53 days. This extra time is not a warning sign to retreat; it is your invitation to re-enter the market with your analytical armor intact.
3. The Return of Negotiation: The Buyer’s Bill of Rights Restored
For years, real estate education focused heavily on how buyers could make their offers more competitive by stripping away contractual protections. In mid-2026, the 52-day market has officially restored what we call the Buyer’s Bill of Rights. When a homeowner watches their property sit through two consecutive weekends without an offer, their posture during negotiations shifts from dictatorial to collaborative.
Here is how longer days on the market translate into tangible operational leverage for buyers this summer:
The Luxury of Due Diligence and Multiple Showings
During the peak bidding war era, buying a home felt more like winning an auction on eBay than making a life-altering financial investment. Buyers were forced to tour a property for 15 minutes during a crowded open house and submit a non-contingent offer by Sunday evening.
Today, a 52-day median marketing timeline means you can actually behave like a prudent consumer. You have the time to schedule an initial private showing on a Tuesday morning. If you like the layout, you can take 48 hours to review your personal budget, drive through the neighborhood on a Friday evening to evaluate noise levels and traffic patterns, and schedule a second showing on Saturday with your contractor or family members. Sellers whose homes have been active for 30+ days are no longer imposing arbitrary 24-hour offer review deadlines; they are genuinely grateful for repeat showings.
Reclaiming the Inspection Contingency
Perhaps the most destructive trend of the pandemic real estate boom was the widespread waiving of home inspection contingencies. Thousands of buyers purchased properties without inspecting what lay beneath the drywall, only to discover cracked foundations, failing sewer laterals, and outdated electrical grids months later.
In the summer of 2026, the inspection contingency has made a complete, triumphant return. When you submit an offer on a property that has been active for 45 days, you can confidently include a standard 10-to-14-day structural and environmental inspection period. More importantly, when your licensed inspector identifies necessary repairs—such as a roof nearing the end of its architectural life or an aging HVAC unit—you now have the leverage to return to the negotiating table. You can formally request that the seller complete the repairs prior to closing or provide a credit at settlement. In a balanced market, sellers know that if they lose you over a legitimate inspection item, the next buyer who comes along will demand the exact same repair.
Protection Against Appraisal Gaps
When property values were appreciating by 2% per month, appraisal gaps were a common hurdle. If a buyer offered $500,000 on a home that appraised for $470,000, the buyer was routinely forced to bring an additional $30,000 in cash to the closing table to bridge the gap.
In today's stabilized environment, national property appreciation has moderated into sustainable single-digit territory. Comprehensive quarterly analytics confirm this moderation, indicating that
4. The "De-Listing" Phenomenon and Shadow Inventory Explained
As you navigate the MLS this summer, you will likely notice a fascinating behavioral counter-trend among homeowners: rather than letting their properties sit indefinitely or taking aggressive price cuts, a growing segment of sellers is simply taking their ball and going home. This is known in the real estate industry as the De-Listing Phenomenon, and understanding its mechanics is critical for anyone looking to master the mid-2026 housing landscape.
Recent MLS reporting highlights just how widespread this trend has become. According to leading industry data analysis,
The Mechanics of the Mortgage Rate "Lock-In" Effect
The primary driver behind the de-listing wave is the unprecedented gap between the mortgage rate homeowners currently hold and the rate they would face upon repurchasing. Roughly 60% of American homeowners with mortgages currently enjoy interest rates below 4%, locked in during the pandemic refinancing boom.
When these homeowners test the waters by listing their home for sale in mid-2026, many are doing so aspirationally. Industry research into seller psychology confirms this dynamic, revealing how
If an aspirational seller lists their home for $550,000 and the market responds with feedback indicating the true value is closer to $510,000, the seller does a quick mathematical calculation. They realize that trading a 3.5% mortgage on a current home for a 6.58% mortgage on a replacement property at a reduced sales price simply does not make financial sense unless they are forced to move by external life events. Instead of accepting a lower offer, they execute a temporary withdrawal or let the listing expire.
Why De-Listings Are Actually Great News for Market Stability
At first glance, you might assume that rising de-listings are bad for buyers because they remove potential inventory from the public feed. However, from an economic and investment standpoint, this trend provides an incredible layer of protection for your purchase.
When aspirational sellers voluntarily remove their homes from the market rather than engaging in a race to the bottom with price cuts, they actively prevent inventory gluts from forming. In a traditional housing crash—such as the 2008 financial crisis—distressed sellers were forced to liquidate regardless of price, flooding the market with inventory and causing home values to free-fall. In 2026, homeowners possess record levels of home equity, giving them the resilience to simply step away if the market does not meet their price.
This self-regulating supply mechanism builds a solid concrete floor under national home values. When you purchase a home this summer at a fair, negotiated price, you can do so with the confidence that the underlying market is structurally supported against sudden, catastrophic price devaluation.
Unlocking "Shadow Inventory" as a Proactive Buyer
For the proactive investor and well-represented buyer, the de-listing trend creates a lucrative underground market known as Shadow Inventory. When a property is delisted after sitting for 60 days, the homeowner's underlying reason for wanting to sell does not magically disappear. Whether they were looking to downsize, relocate closer to grandchildren, or liquidate an inherited property, that motivation remains dormant beneath the surface.
At the Discount Property Investor Team, we actively monitor canceled and expired listing feeds across our target markets. When a property comes off the market after failing to sell at an inflated price, that seller is often frustrated with the retail process and worn down by weeks of keeping their house clean for unproductive showings. By reaching out to these de-listed owners 30 to 45 days after their listing expires—offering a clean, professional proposal with realistic pricing, flexible closing timelines, and no pressure—you can frequently secure off-market transactions without competing against retail buyers on the MLS.
5. Actionable Buyer Strategies: Mastering Seller Concessions and Buydowns
Now that we have diagnosed the mechanics of the 52-day market and unpacked the psychology of de-listings, let us transition from theory to execution. How can you, as an individual buyer or real estate investor, practically extract maximum financial value from homes that are sitting on the market this summer?
The secret weapon of the mid-2026 buyer is not simply asking for a lower price; it is mastering the art of the Seller Concession.
In real estate negotiations, sellers are often intensely emotional about their top-line contract price. A seller might fiercely resist a $15,000 reduction in their asking price because of pride or because they promised themselves a certain number to tell their neighbors. However, that exact same seller will frequently agree to provide a $15,000 Closing Cost Credit or Interest Rate Buydown if the top-line contract price remains intact. Here is how to structure these concessions to slash your out-of-pocket costs and lower your monthly mortgage payments.
Strategy A: The Permanent Interest Rate Buydown
When mortgage rates sit near 6.58%, your primary objective should be reducing your long-term cost of borrowing. Instead of negotiating a $10,000 price drop on a $400,000 home—which only lowers your monthly principal payment by about $60 per month—you can structure your offer to request a $10,000 seller credit dedicated specifically to buying down your permanent interest rate through discount points.
By paying discount points to your lender at closing using the seller's money, you can permanently reduce your mortgage rate from 6.58% down to roughly 5.85% or 6.00% for the entire 30-year life of the loan. This permanent reduction can save you upwards of $180 to $220 every single month, resulting in tens of thousands of dollars in compound interest savings over the duration of the mortgage—all funded entirely by the seller.
Strategy B: The 2-1 Temporary Buydown
If you anticipate that national economic conditions and Federal Reserve policies will lead to broader refinancing opportunities over the next 24 to 36 months, the 2-1 Temporary Buydown is an exceptional strategy to deploy on sitting inventory.
With a 2-1 buydown, the seller contributes a lump-sum credit into an escrow account at closing. This fund is used to subsidize your interest rate by 2 percentage points during the first year of your mortgage, and by 1 percentage point during the second year, before stabilizing at the standard fixed rate in year three.
For example, if the baseline 30-year rate is 6.58%, your payment schedule under a seller-funded 2-1 buydown would look like this:
-
Year 1: Payments calculated at an effective rate of 4.58% (massive immediate monthly savings).
-
Year 2: Payments calculated at an effective rate of 5.58% (significant ongoing savings).
-
Year 3 through 30: Payments adjust to the baseline note rate of 6.58% (unless you refinance earlier into a lower permanent rate).
This structure gives you tremendous early liquidity during the critical first two years of homeownership—funds that can be redirected toward home improvements, furniture, or building an emergency cash reserve.
Strategy C: Aggressive Closing Cost Offset
For many first-time buyers and active investors, preserving cash capital is paramount. When purchasing a property, closing costs—including loan origination fees, title search and insurance policies, appraisal fees, transfer taxes, and escrow pre-payments for property taxes and homeowners insurance—can easily add up to 3% to 4% of the purchase price. On a $400,000 acquisition, that represents $12,000 to $16,000 in liquid cash required above and beyond your down payment.
When targeting a home that has crossed the 45-day threshold on the MLS, your primary negotiation script should focus on offsetting these expenditures. Write your offer with a stipulation requesting that the seller contribute 3% of the purchase price toward your recurring and non-recurring closing costs. In today's market, where sellers are anxious to prevent their property from becoming stale inventory, paying a buyer's closing costs is universally viewed as a viable path to securing a definitive closing date.
6. Local Market Nuance vs. National Headlines: The Investor Perspective
As you apply these strategies, there is one foundational rule you must never forget: real estate is an intensely local asset class. While national statistics provide a valuable macroeconomic compass, they represent a blended average of thousands of distinct micro-markets across the North American continent. Taking a national headline at face value and applying it blindly to your neighborhood is a recipe for missed opportunities or faulty investments.
At the Discount Property Investor Team, we frequently remind our students and clients that national housing reports can obscure what is actually occurring on your specific street corner. Let us examine how regional divergence is playing out across the United States in mid-2026.
The Regional Divide: Midwest Stability vs. Sunbelt Adjustment
When you look at national home price appreciation, the numbers appear modest and steady. However, regional data reveals two distinct narratives playing out simultaneously. In regions where home construction lagged behind population growth for decades, prices are demonstrating exceptional strength.
Recent economic forecasting shows just how powerful these regional variations can be, noting that
Why are Midwestern markets like St. Louis, Indianapolis, and Milwaukee continuing to appreciate while former boomtowns in Austin and Phoenix experience rising inventory and price adjustments? It comes down to basic affordability math. In the Midwest, where median home prices remain near $308,000, local incomes can still comfortably service a 6.58% mortgage. In contrast, markets that saw prices double during the pandemic have hit an affordability wall, requiring longer exposure times and more aggressive price cuts to clear inventory.
Micro-Market Segmentation: Starter Homes vs. Luxury Tiers
Even within the same city, different price tiers are operating under completely different sets of rules.
-
The Starter Home Sector ($250,000 to $400,000): Across most U.S. metros, affordable, turnkey starter homes remain in a structural supply deficit. First-time homebuyers, institutional rental operators, and downsizing baby boomers are all competing for this limited inventory. If a well-maintained home is listed at $320,000 in a good school district, it will still likely sell within 20 days, often with multiple offers. Do not expect massive concessions or 10% price cuts in this competitive entry-level tier.
-
The Move-Up and Luxury Sector ($600,000+): This is where the 52-day market truly shines for buyers. As move-up buyers struggle with the rate lock-in effect on their existing homes, demand for mid-tier and luxury homes has cooled noticeably. Large four-to-five-bedroom homes that require minor cosmetic updates are routinely sitting for 60 to 90 days. It is within this specific property tier that savvy investors and patient families can negotiate $25,000 price reductions, full closing cost coverage, and extensive structural repairs.
To succeed this summer, you must analyze your target neighborhood through a micro-lens. Review local absorption rates, track how many active listings have reduced their pricing over the past 30 days, and identify exactly which price tiers are accumulating inventory. When you know the data better than the listing agent across the table, you negotiate from a position of absolute authority.
Conclusion: Your Summer 2026 Action Plan
The mid-2026 housing market is not a crisis to be feared; it is a long-overdue return to equilibrium that rewards preparation, patience, and professional execution. The days of frantic, panic-driven homebuying are behind us. With national property velocity stabilizing at a healthy 52-day median, you finally have the time and the leverage to make sound, highly defensive real estate investments.
Let us recap the core principles that should govern your acquisition strategy this summer:
-
Embrace the Clock: A property that has been on the market for 45 days is not a red flag; it is an open invitation to negotiate. Use longer marketing timelines to conduct thorough due diligence, schedule repeat showings, and protect yourself with robust inspection contingencies.
-
Understand the De-Listing Buffer: Recognize that homeowners are voluntarily removing properties from the MLS when they don't get their price, preventing catastrophic market inventory floods and establishing a firm foundation under current valuations. Use this knowledge to target dormant off-market shadow inventory.
-
Prioritize Concessions Over Price Cuts: When borrowing costs sit near 6.58%, your highest return on negotiation lies in securing seller-funded interest rate buydowns and closing cost credits. Let the seller keep their headline price while you drastically reduce your out-of-pocket cash requirements and ongoing monthly debt service.
-
Analyze Your Local Micro-Market: Never let sensationalized national economic headlines dictate your localized buying decisions. Identify the specific price tiers and neighborhoods in your city where inventory is accumulating, and focus your acquisition efforts where buyer leverage is highest.Stop waiting for a mythical market crash that the economic data simply does not support. Step into the balanced summer marketplace, apply these strategies, and lock in your next property on your own terms.